

Strategy Verification · Issue 05 · 2 September 2026 · US500 daily, 15.5 years
Connors RSI(2) was the one strategy in our first batch of five that survived. It passes every statistical gate we can throw at it. Then you put it in an account and it loses to buying the index and going to sleep.
Edge is real · Loses to buy-and-hold · Works as an overlay
t = 3.43 · but 4.32%/yr against the index's 10.86% · invested 12% of the time
01 / THE RULES
Five lines, and you can check them on a phone
Larry Connors published this in Short Term Trading Strategies That Work and it has been reposted, repackaged and resold ever since. It is the simplest thing we have tested. It is also the only survivor of our first batch, where the 5-minute opening range breakout, UT Bot, TTM Squeeze and the Nadaraya-Watson envelope all failed.
Connors RSI(2) — as published, as tested
Universe. One broad index. We tested the S&P 500 and, separately, the Nasdaq 100.
Filter. Only take trades when close > SMA(200) — long-term uptrend only.
Entry. Buy when RSI(2) < 10. A two-period RSI hits single digits after a sharp two- or three-day drop.
Exit. Sell when close > SMA(5). Typically four days later.
Direction. Long only. No shorts, no options, no stop-loss.
Over 3,911 sessions from April 2013 to August 2026 that produces 139 trades, a 76.3% win rate, a profit factor of 2.23 after costs and a t-statistic of 3.43 on per-trade returns. By the standards of what circulates online, that is an unusually solid result. We spent the rest of the day trying to break it.
02 / THE GATES
Four ways it could have died, and didn't
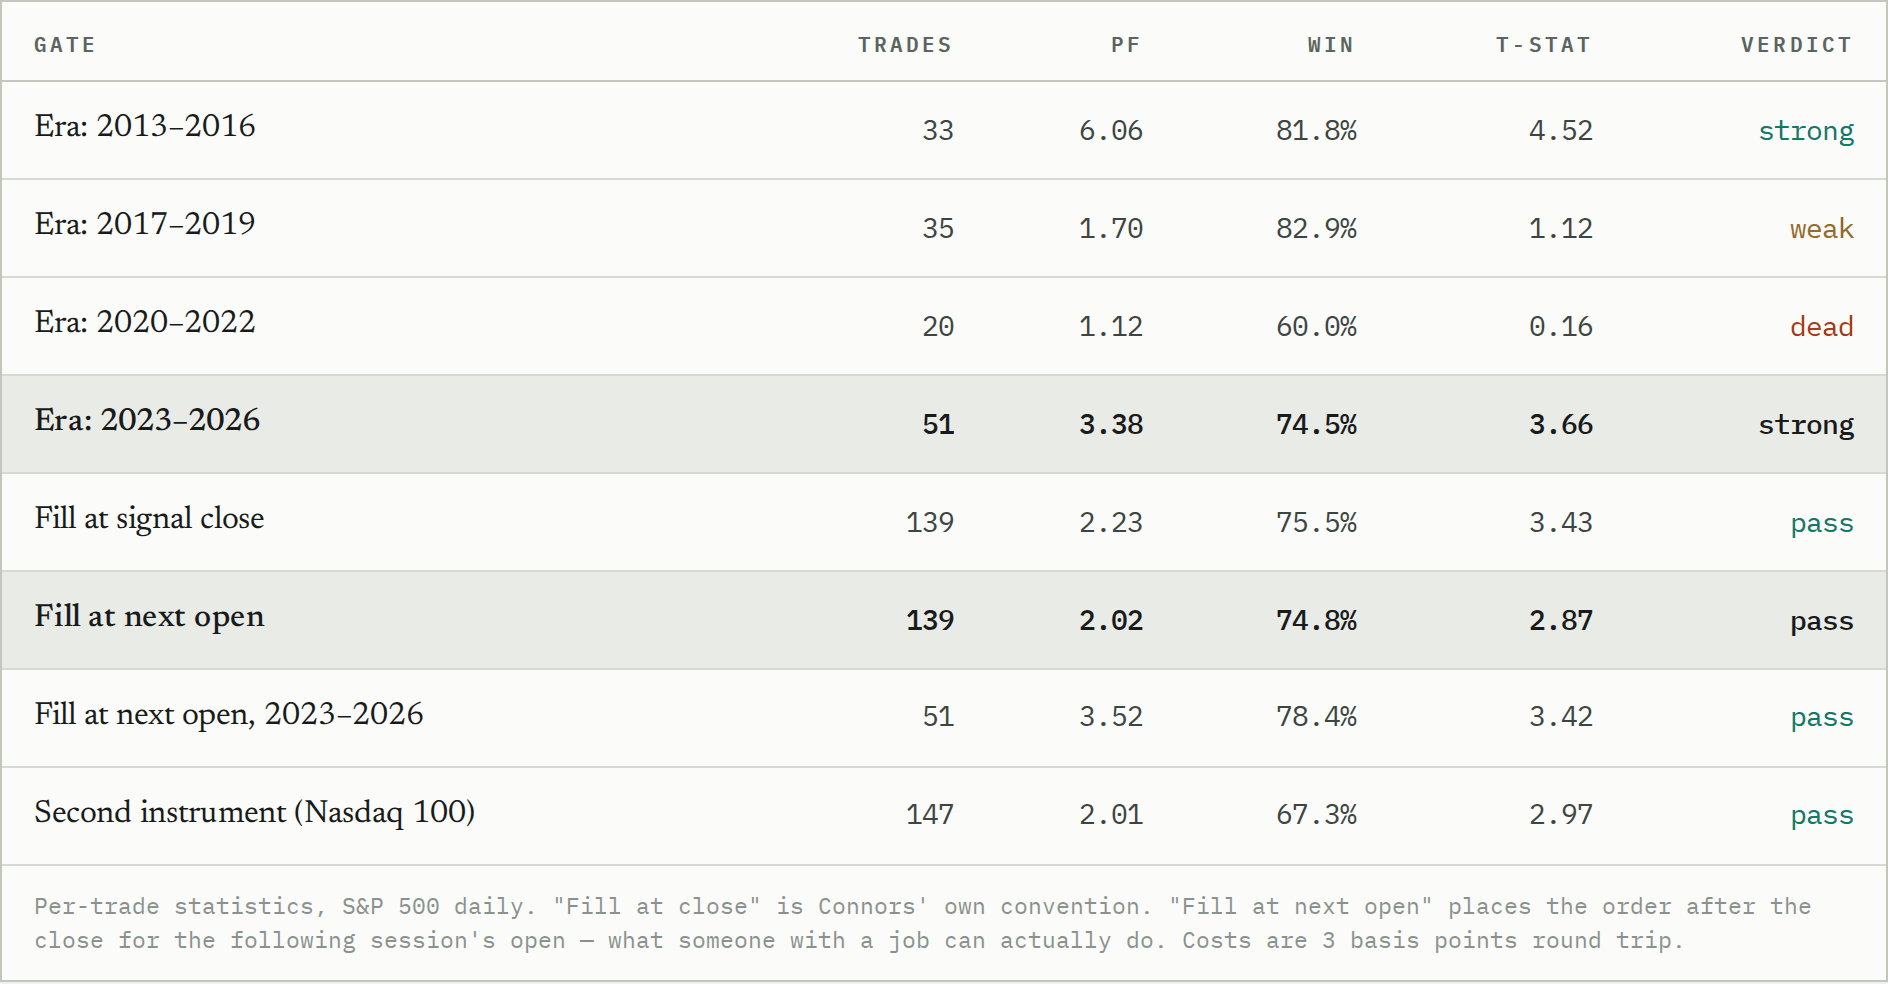
It has a dead patch. From 2020 to 2022 the edge went to nothing — 20 trades, profit factor 1.12, t of 0.16. Three years of doing the work for no reward. Anyone running this needs to know that in advance, because three flat years is exactly how long it takes to abandon a system right before it starts working again. 2023 to 2026 is the second-strongest era in the record.
You do not need to trade the close. This is the finding that matters most for anyone with a job, and it surprised us. Connors' rules assume you buy at the close of the signal day. Place the order for the next session's open instead and the profit factor falls from 2.23 to 2.02 — you give up about a fifth of the edge. In the 2023–2026 era the next-open fill is actually better than the close fill, 3.52 against 3.18. You can run this with an order placed the night before.
It is a plateau, not a knife-edge. Every parameter we varied kept working: threshold 5, 10, 15 and 20 all produce t-statistics above 2.7; RSI periods 2, 3 and 4 all work; the 200-day filter can be a 100-day filter. Two changes are genuine improvements on the published version, and we say so below.
03 / THE REVERSAL
Now put it in an account
Everything above is a per-trade statistic. A per-trade statistic tells you how good the trades are. It does not tell you how good the account is — and for a strategy that is invested 12.1% of the time, those are not the same question.
So we ran the account. Capital sits in one-month T-bills when flat, buys the index at the open when the signal fires, sells at the open when the exit fires, pays three basis points a round trip. This is the number that would actually have appeared on a statement.
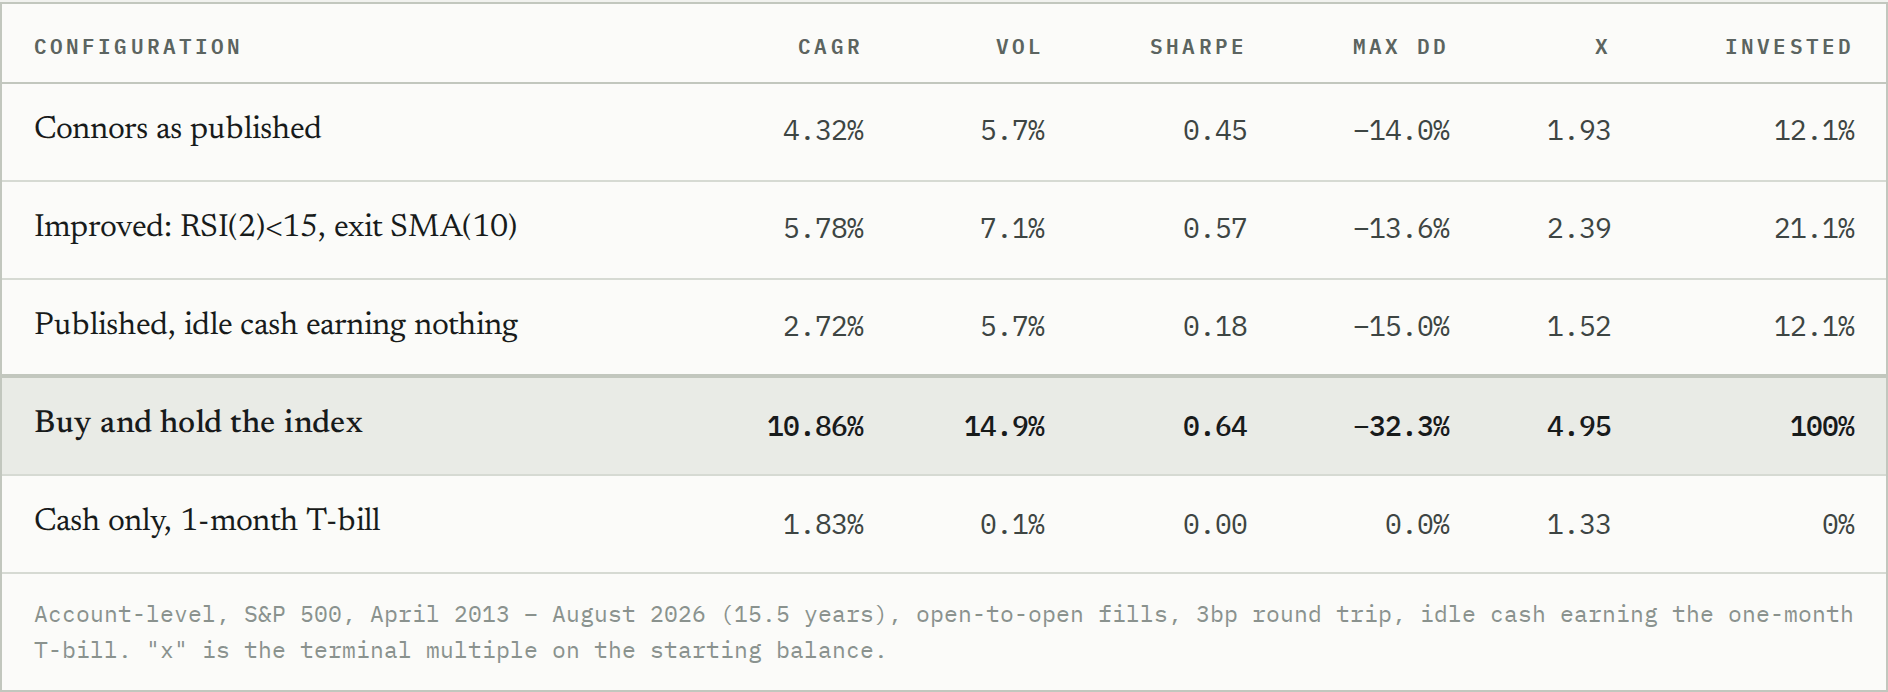
Buy and hold turns one unit into 4.95. Connors turns it into 1.93. Over fifteen and a half years the strategy that wins 76% of its trades finishes at 39% of the wealth of doing nothing at all — and loses on Sharpe too, 0.45 against 0.64.
Look at the third row. With idle cash earning zero instead of the T-bill rate, the account makes 2.72% instead of 4.32%. More than a third of the return is the money market, not the strategy. That is what "invested 12% of the time" means in practice, and it is invisible in every per-trade statistic ever posted about this system.
A 76% win rate and a t-statistic of 3.43, and it still finishes at 39% of the wealth of doing nothing.
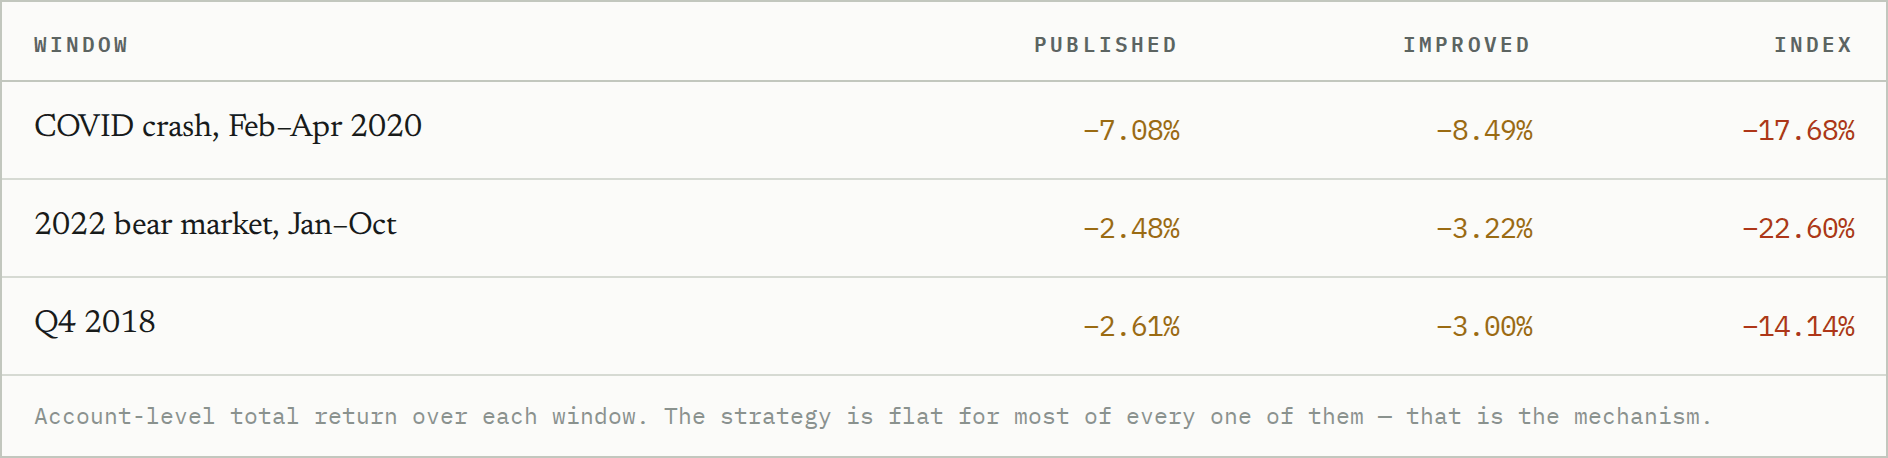
What it does buy is calm. The worst account drawdown is −14.0% against the index's −32.3%, at 5.7% volatility against 14.9%. In the three worst stretches of the period it lost a fraction of what the index lost:
04 / THREE FIXES
Two that fail, one that works
A strategy that is right most of the time but under-deployed has an obvious remedy: deploy more. There are three ways to do it and only one of them survives contact with a borrowing cost.
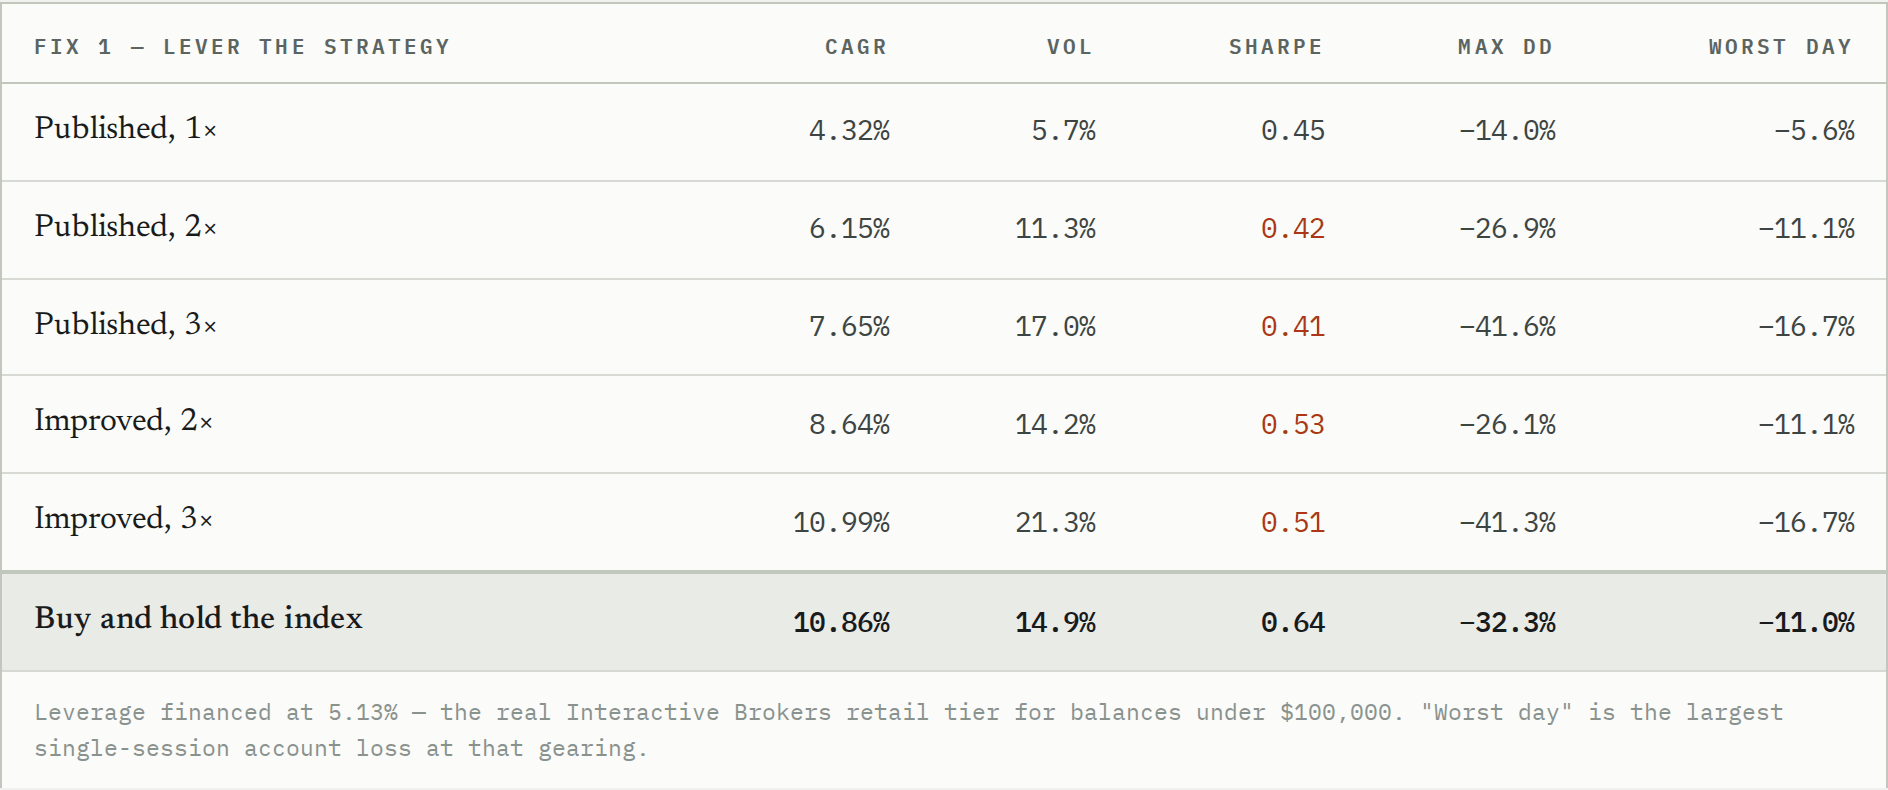
Fix 1 fails. Every step of leverage lowers the Sharpe ratio — 0.45 to 0.42 to 0.41. You can reach the index's return by gearing the improved version to 3×, but you get there at 21.3% volatility and a −41.3% drawdown, against the index's 14.9% and −32.3%. You are buying return with borrowed money at 5.13% and the edge is not wide enough to pay for it.
Fix 2, changing the parameters, is a real but partial improvement. Widening the entry to RSI(2) < 15 and slowing the exit to close > SMA(10) lifts the account from 4.32% to 5.78% and the Sharpe from 0.45 to 0.57, with a slightly smaller drawdown. More trades, held longer, invested 21% of the time instead of 12%. Still behind the index.
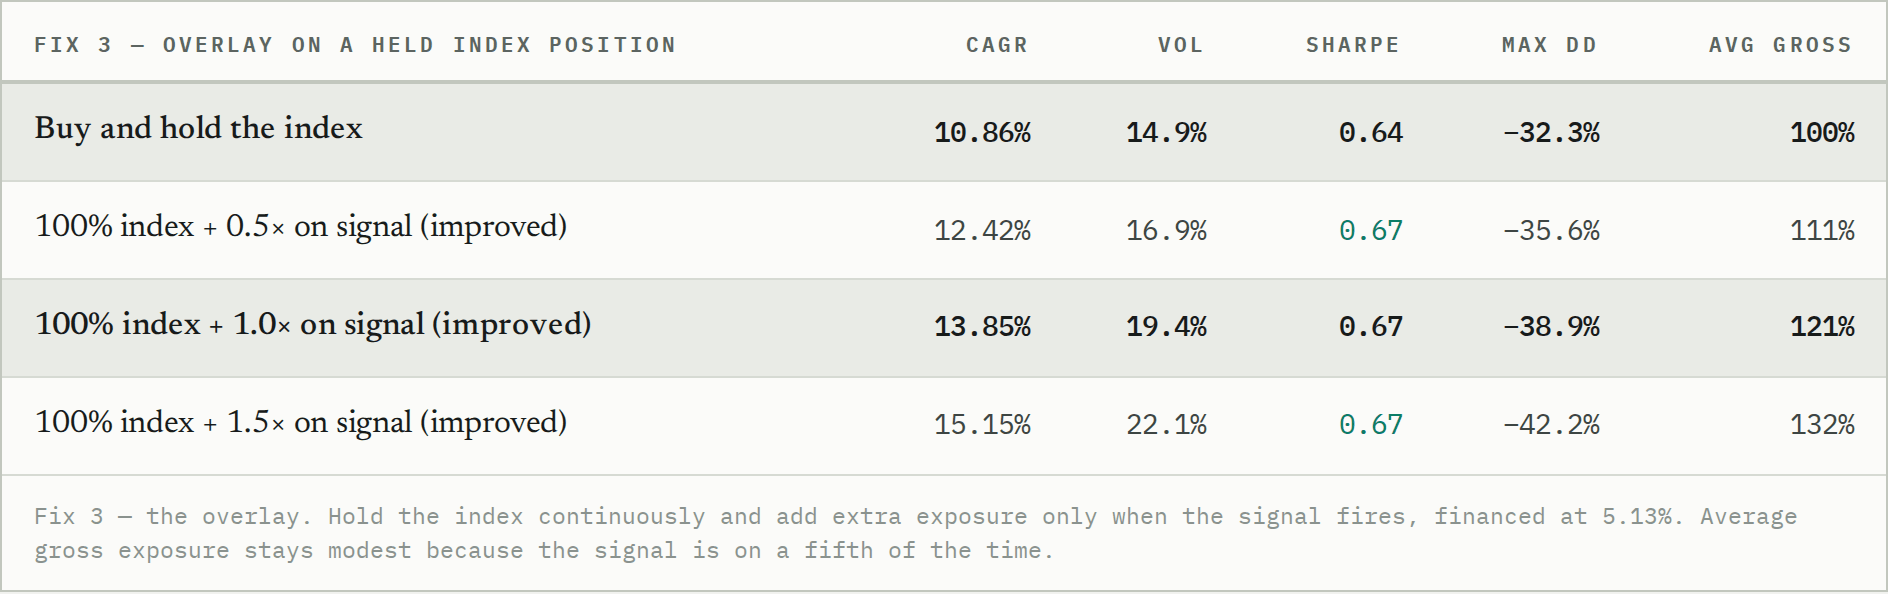
Fix 3 works, and we want to be careful about how loudly we say so. The overlay beats buy and hold on return at every setting, and it is the only configuration in this piece that also beats it on Sharpe — 0.67 against 0.64.
But read the size of that edge. Three basis points of Sharpe is not a discovery, it is a rounding error away from "leverage priced fairly". The overlay adds about three points of annual return in exchange for 4.5 points of volatility and 6.6 points of drawdown. Most of what you are being paid is compensation for risk you chose to take, and only a sliver is the signal. If someone sells you this as alpha, they are selling you margin.
Since January 2023 the overlay returned 23.18% at a Sharpe of 0.93, against the index's 18.09% at 0.91. Same story at a different scale: meaningfully more money, essentially the same risk-adjusted quality.
05 / HOW TO RUN IT
Six steps, ten minutes a day, no screen time
If you have read the section above and still want to run it, here is the whole procedure. It needs a daily close, three indicators and one order. Nothing here requires watching the market.
1. Pick the instrument and the sizing
A liquid broad-index ETF — SPY, VOO or IVV for the S&P 500. Decide up front whether you are running the standalone version (cash when flat) or the overlay (index always held, extra exposure on signal). They are different products with different risks; do not switch between them mid-drawdown.
2. After the close, compute three numbers
RSI(2), SMA(5) or SMA(10), and SMA(200) on daily closes. Any charting package gives you all three. The two-period RSI is the only unusual setting — most defaults are 14.
3. Apply the entry test
Flat, and close > SMA(200), and RSI(2) below your threshold — 10 for the published version, 15 for the improved one. If all three are true, you buy.
4. Place a market-on-open order for tomorrow
This is the step that makes the strategy compatible with a job. Our testing shows the next-open fill costs about a fifth of the edge against Connors' close fill, and nothing at all in the recent era. Submit it the evening before and go to bed.
5. Check the exit the same way, every session
In a position and close > SMA(5) — or SMA(10) for the improved version — you sell at the next open. Median holding period is four days. There is no stop-loss in the published rules, which is the single largest risk in the system: the worst trade in the record lost 7.37% in March 2020.
6. Automate it, or write down what you will do in the dead patch
The whole thing is a handful of lines against the IBKR API and it is the most automatable strategy this lab has tested. If you are running it by hand, write down in advance what you will do during three flat years, because 2020–2022 will happen again and discretion is how systems die.
RETAIL GATE
12 out of 12 — the first perfect score
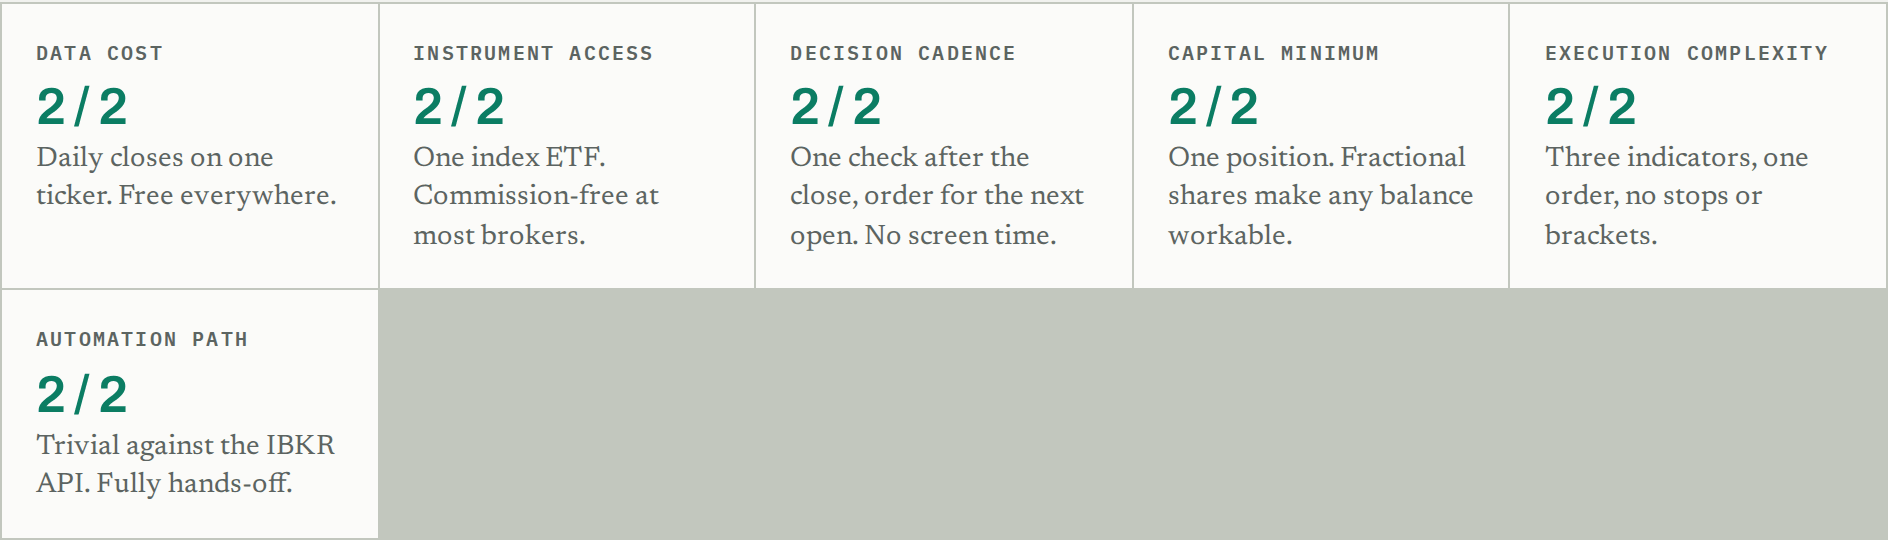
This is the highest Retail Gate score we have recorded, and it deserves stating plainly: the barrier to running Connors RSI(2) is not access, cost, capital or complexity. It is that the thing you would be running does not beat the index unless you lever it, and levering it is most of where the extra return comes from.
06 / THE TRANSFERABLE PART
Ask what the account did, not what the trades did
The gap between "profit factor 2.23, t-statistic 3.43" and "39% of the wealth of doing nothing" is not a contradiction. Both are true. They answer different questions, and only one of them is the question you have.
Any strategy that sits in cash has this problem, and the less time it spends invested the worse it gets. A swing system that is in the market a tenth of the time can have a beautiful trade distribution and still leave you poorer than a savings account plus an index fund, because ninety per cent of your capital was doing nothing while the market compounded without you. Win rate, profit factor, average trade and t-statistic are all silent on this. They are computed over trades, and the trades are not your life.
Three questions turn a per-trade claim into an account claim. What percentage of the time is it invested? Below about 30% and you should assume the headline is misleading until proven otherwise. What is the idle capital earning? In this case more than a third of the total return, which means the same strategy would have looked substantially worse in the zero-rate years and the backtest quietly took credit for the Federal Reserve. And what did buy and hold do over the identical window? Not the strategy's own equity curve in isolation — the alternative you actually had.
None of this makes Connors RSI(2) a bad system. It is a genuine, replicable, statistically significant edge, it is the most retail-runnable thing we have tested, and it protects capital in crashes in a way holding the index does not. It is simply much smaller than it looks, and where you deploy it matters more than whether you have it.
Method
Data: Dukascopy 1-minute bid, resampled to regular-hours daily bars, gap-repaired to zero missing weekdays. US 500, 3,911 sessions, 2013-04-16 to 2026-08-31; US Tech 100, 4,260 sessions, used as the second-instrument check. Indicators are Pine-compatible: RSI on an SMA-seeded Wilder average, SMAs on closes.
Per-trade tests: entry and exit both at the signal-day close (Connors' convention) or both at the following session's open, 3 basis points charged per round trip. Account tests: open-to-open index returns while held, one-month T-bill on idle balances, cost charged on each side of a position change, leverage financed at 5.13% — the Interactive Brokers retail tier for balances under $100,000. Positions are decided at the close and filled at the next open throughout, so no result uses information it could not have had.
An earlier note in our batch-1 write-up described this strategy as returning "roughly 3× per unit of exposure at a fifth of the drawdown". That is arithmetically correct and, as a headline, misleading — it is the per-trade framing this piece exists to correct. The account-level comparison above supersedes it.
Sources
Larry Connors and Cesar Alvarez, Short Term Trading Strategies That Work (2008), for the original rules · Batch 1 verification, this lab, 1 September 2026 · Interactive Brokers published margin rates
Backtested results are hypothetical and do not represent returns any investor achieved. This is research, not investment advice.