

Strategy Verification · Issue 04 · 2 September 2026 · 26,274 trading days
Carlo Zarattini and Gary Antonacci published a trend-following strategy that returned 18.2% a year for a hundred years. We reproduced it to within a tenth of a point — and then found that everything you could actually buy it with has lost to the index for thirty-six years.
Replicates · Edge is pre-1990 · Fails on tradeable instruments
18.31% claimed 18.2% · investable version 5.91% vs market 11.39%
01 / THE CLAIM
A hundred years, 18.2% a year, a third of the market's drawdown
A Century of Profitable Industry Trends is a serious paper by serious people. Gary Antonacci wrote the book on dual momentum; Carlo Zarattini runs Concretum and publishes more replicable research than most academics. The paper is fully specified — every band, every parameter, every sizing rule is in the text — which is precisely why it was worth testing.
The rules are compact. Build a price index for each of Ken French's 48 industry portfolios. Around each one draw two channels: a Donchian channel on closing prices, and a Keltner channel adapted to closes, EMA(P,n) ± 1.4·k·mean(|ΔP|,n). Go long when the price closes at or above the lower of the two upper bands. Exit on a trailing stop set to the higher of the two lower bands, ratcheted so it is never revised down. Size each position at (1.5%/N) ÷ σ on 14-day volatility, cap gross exposure at 200%, rebalance daily, park cash in one-month T-bills.
Long only. No shorting, no options, no leverage beyond 2×. The claimed result is an 18.2% internal rate of return at 12.6% volatility with a 33% maximum drawdown, against a market that lost 84% of its value at the bottom of 1932.
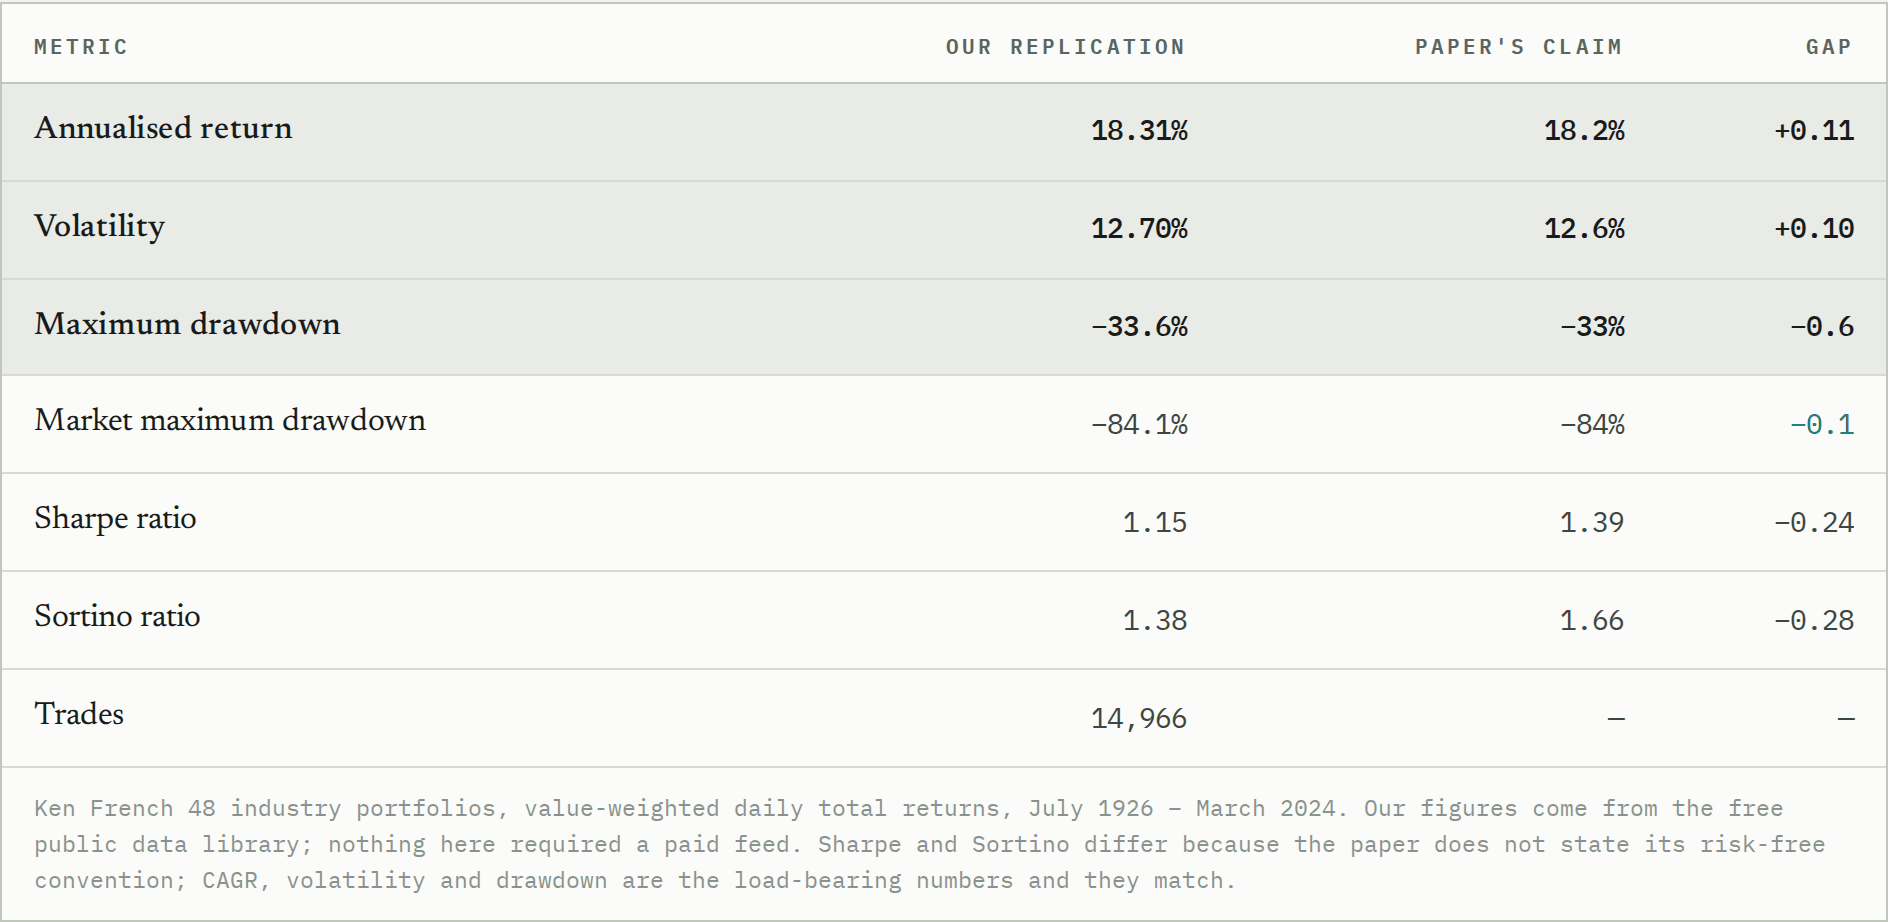
That is a clean replication. The paper says what it did, and doing what it says produces what it reports. Most of what circulates as a "backtested strategy" does not survive this step. This one does, and that is the reason the rest of this piece is worth reading — everything below is built on numbers the authors would recognise as their own.
02 / THE FIRST THING THE HEADLINE HIDES
Sixty-three per cent of the century was made before 1980
A hundred-year average is a single number laid over eleven very different decades. Split it, and the strategy's excess return over the market has a shape nobody would advertise.
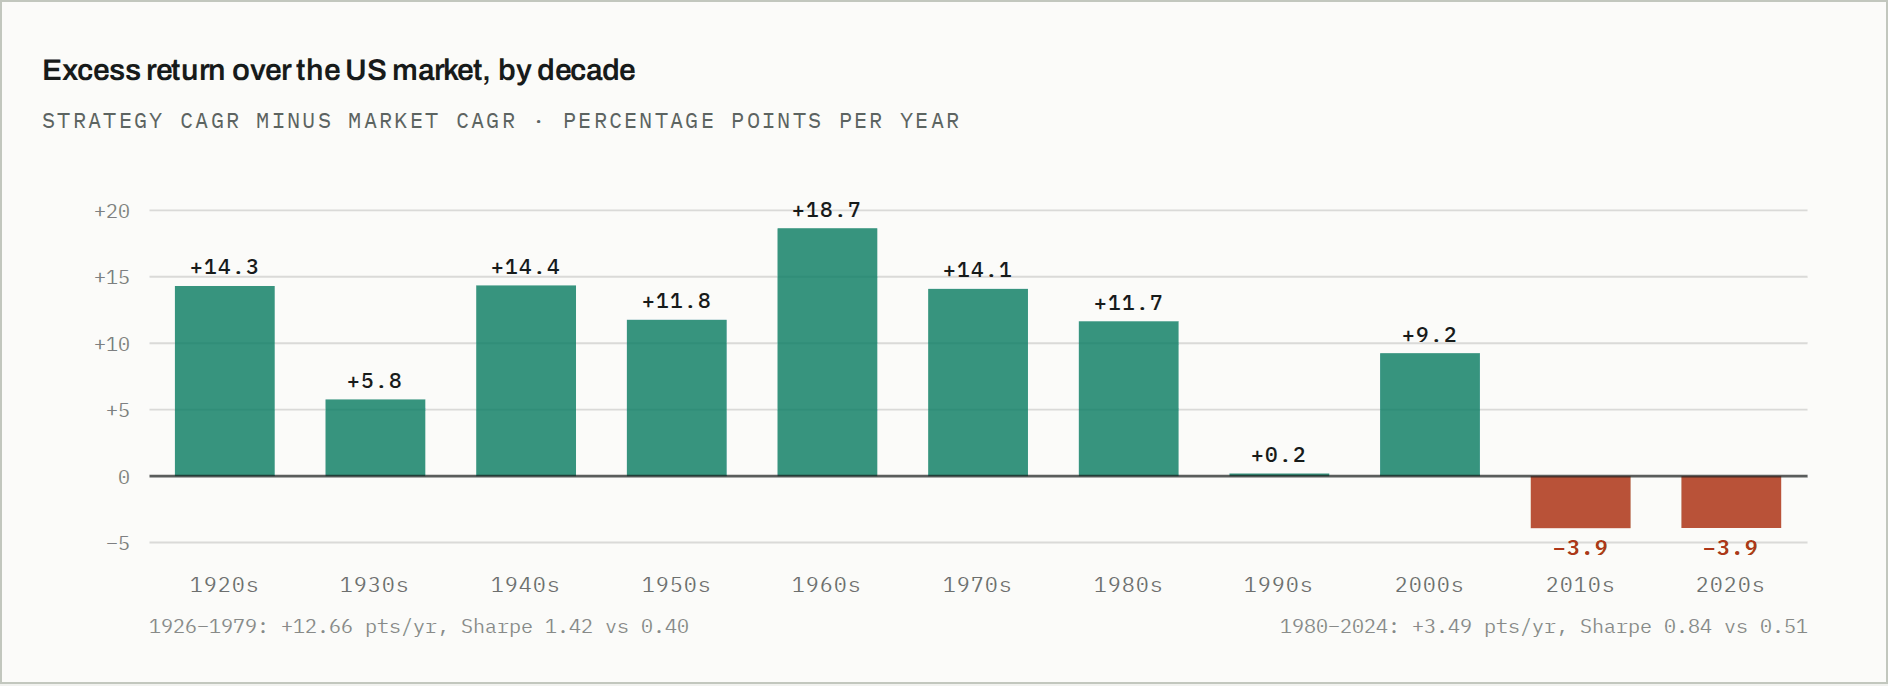
Excess return is the strategy's compound annual return minus the US total-market return over the same days. Partial decades at each end (1926–29, 2020–Mar 2024) are computed on the days available. The 1990s reading of +0.20 turns to −1.62 once realistic trading friction is charged.
The strategy beat the market by more than eleven points a year in every decade from the 1920s to the 1980s. Then the 1990s came in flat. The 2000s look like a return to form at +9.2, but read what happened: the market went nowhere that decade, losing 0.39% a year and drawing down 54.6%. The strategy made 8.85% by sitting in cash through two crashes. That is defence, not edge.
Then the 2010s: −3.92. The 2020s so far: −3.90. Sixty-three per cent of the century's total compound growth was banked before 1980, in industry portfolios that were not investable, at a turnover nobody could have paid for, in an era when the average holding cost of a US equity position was an order of magnitude higher than today.
Every decade from the 1920s to the 1980s: at least +11 points a year. Every decade since: zero or negative.
03 / THE SECOND THING
You cannot buy a Ken French industry portfolio
The 48 industry portfolios are academic constructs — value-weighted baskets of every CRSP-listed firm in a SIC bucket, rebalanced each June, with no fund behind them. To trade this you need the paper's second test: 31 SPDR sector and industry ETFs. That version is the one a retail investor could actually run, and it is the one the abstract does not lead with.
We rebuilt it with the same engine on XLB XLE XLF XLI XLK XLP XLU XLV XLY XLRE XLC plus the industry SPDRs KBE KCE KIE KRE XAR XBI XES XHB XHE XHS XITK XME XNTK XOP XPH XRT XSD XSW XTH XTL XTN XWEB — every one of them available in any brokerage account, commission-free at most brokers. Twenty and a half years, January 2006 to June 2026.
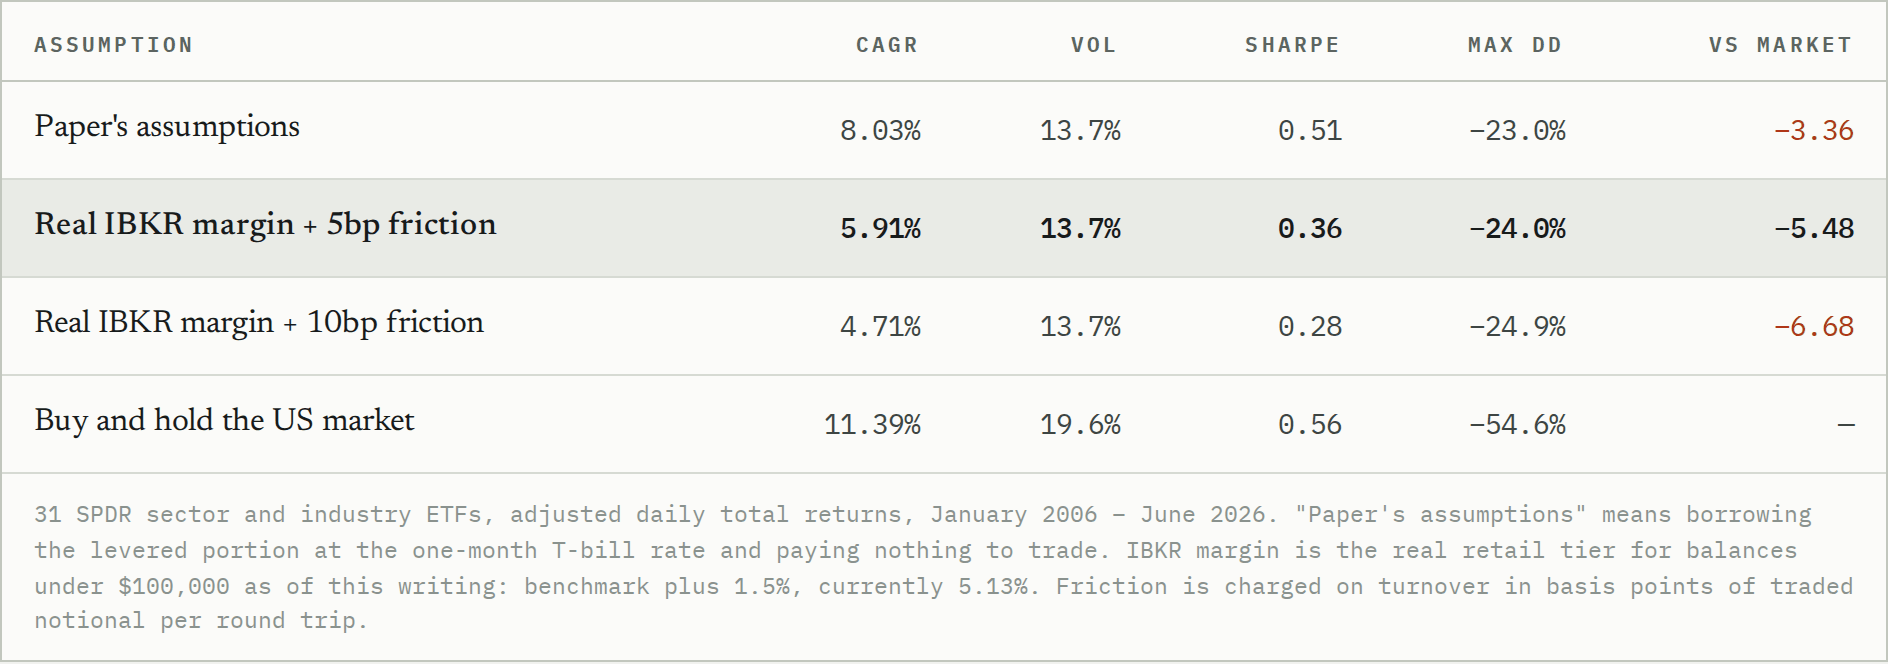
On the authors' own generous assumptions — free trading, institutional borrowing — the investable version returns 8.03% against the market's 11.39%, at a Sharpe of 0.51 against 0.56. It loses on return and it loses on risk-adjusted return. Charge the margin rate an actual retail account pays and five basis points to trade, and it makes 5.91%: barely half the index, for 2,270% annual turnover and a 28.2% win rate across 2,934 trades.
The one thing it delivers is the drawdown promise. −23.0% against the market's −54.6%. Hold that thought; we come back to it.
04 / FIVE GATES
We tried to break our own result, then tried to rescue theirs
A negative finding is only worth publishing if you have attacked it as hard as you would attack a positive one. Five tests, in the order we ran them. The first two ask whether our engine is trustworthy. The last three ask whether the strategy can be saved.
01 · Does the engine peek at the future?
Feed it twenty random walks with the same drift and the same volatility as the real industry portfolios. A clean engine can only earn the drift. An engine with lookahead earns more.
CLEAN. Strategy returns 8.79% on random walks against a 12.72% buy-and-hold drift — it underperforms by 3.94 points, exactly as a system with no edge and periodic cash holdings should. Standard deviation across seeds 0.29.
02 · Are the published parameters a lucky cell?
Eight settings around the published 20-day entry / 40-day exit / k = 2, tested on the investable ETF universe.
NOT A KNIFE-EDGE — AND THAT MAKES IT WORSE. All eight land between 4.71% and 6.72% after realistic costs, against 11.39% for buy and hold. Robust, and robustly behind the index. Worth saying plainly: the published parameters are not even the best cell we found, so there is no sign the authors tuned to the answer.
03 · Can the turnover be cut to something a person could run?
2,270% a year is the retail killer — that is every position turned over twenty-three times annually, in a taxable account, on daily closes. So: keep the daily stop, because you must always be able to get out, but only add positions and resize weekly or monthly.
NO. Weekly rebalancing cuts turnover from 22.6× to 14.5× and the return from 5.92% to 5.04%. Monthly cuts turnover to 7.4× and the return to 2.50%. The return falls faster than the cost it saves. There is no low-turnover version of this strategy.
04 · Is the trend signal doing any work at all?
Gate 03 implies something specific: if slowing the rebalance destroys the return, maybe the return lives in the rebalance and not in the signal. So strip the signal out entirely — same volatility-target sizing, same 200% cap, same daily rebalance, but always long everything.
OVER THE CENTURY, YES. ON TRADEABLE INSTRUMENTS, NO. Across 48 industries 1926–2024 the signal earns its keep: 18.31% at Sharpe 1.15 and −33.6% drawdown, against 14.41% at Sharpe 0.67 and −78.9% with the signal off. But on the 31 ETFs since 2006, turning the signal off returns 11.75% at Sharpe 0.58 — better than the 8.03% at 0.51 you get with it on.
05 · Would random entries have done as well?
The control that separates a signal from a sizing scheme: enter and exit at random, matched to the real strategy's 65% time-in-market, run through the identical volatility-targeting machinery.
ONLY IF TRADING WERE FREE. Random entries reach Sharpe 0.64–0.65 at zero cost — comparable to the real signal. But they turn over 163–207× a year, and at 5bp the random arm collapses to 0.00 and −0.22. What the trend rules genuinely provide is not the edge; it is doing the volatility targeting at a turnover low enough to survive friction.
05 / WHAT SURVIVES
A drawdown machine, priced as an alpha machine
There is something real here, and it is not the 18.2%.
Across the investable universe the strategy cut the worst drawdown from −54.6% to −23.0% — less than half — and did it at 13.7% volatility against the market's 19.6%. In the 2000s that protection was worth +9.2 points a year, because avoiding two crashes was the whole game. In the 2010s and 2020s it cost about four points a year, because there was nothing to avoid and plenty to miss.
So the honest description is: this is a defensive equity allocation with an unusually good crisis record and a persistent drag in trending markets. Whether that is worth owning depends entirely on what you think the next decade looks like — which is a forecast, not a backtest, and the paper's abstract does not present it as one.
The independent critique reaches a compatible conclusion from a different direction. Refining and Robust Backtesting of A Century of Profitable Industry Trends attempted a walk-forward validation and could not confirm the result, concluding the original was likely overfit. We did not test for overfitting — we tested for tradeability — and arrived at the same place by another road.
RETAIL GATE
Could you run it, if it worked?
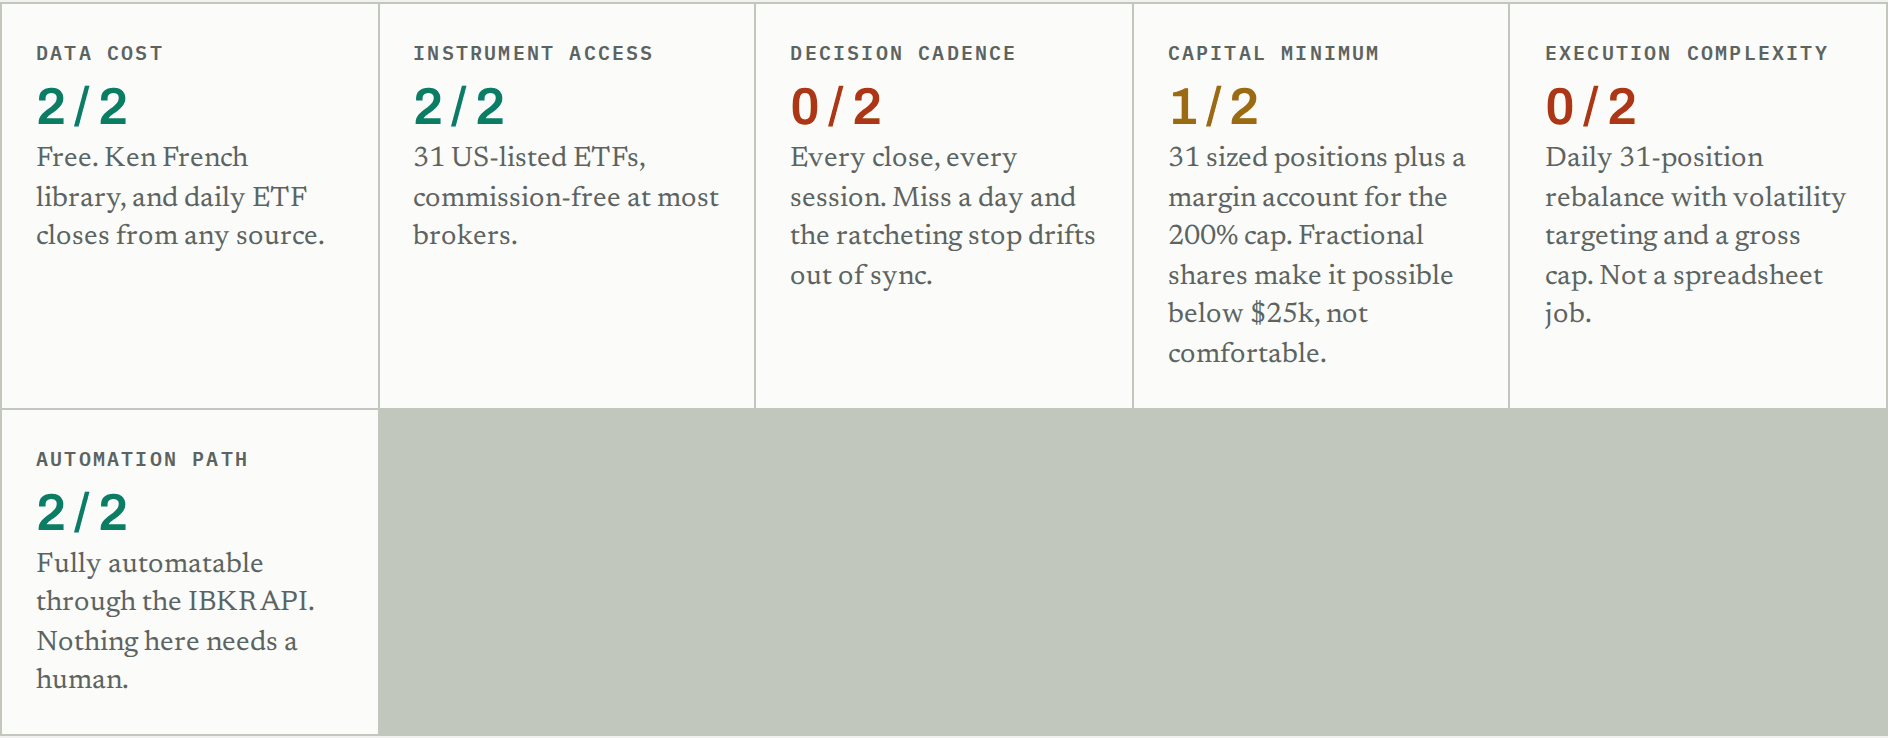
7 out of 12. The barriers are cadence and complexity, not money or access — which is the unusual case where automation genuinely solves the retail problem. It would be a good candidate for a hands-off implementation, if the returns were there. They are not.
06 / THE TRANSFERABLE PART
What to check before you trust a long backtest
Three questions, in this order, and they generalise well beyond this paper.
Could you have traded the instruments? A century of industry portfolios is a century of academic constructs. Sector ETFs are twenty years old, and the SPDR industry funds mostly younger than that. Any result whose good years pre-date the vehicles is a result about a market that could not be accessed.
Where is the return concentrated in time? Not "is the average good" but "which decades paid for the average". If more than half the compound growth lands before the era you would actually be trading in, the headline is a historical claim, not a forward one.
What does the strategy cost to run, at your rates? The paper borrows at the one-month T-bill rate. A retail account at Interactive Brokers under $100,000 pays benchmark plus 1.5% — 5.13% at the time of writing. Over a century that gap costs 0.87 points of annual return; in the modern era, where the strategy's total excess return is negative anyway, it is the difference between a marginal idea and a clearly bad one.
None of this is a criticism of the authors' honesty. Their paper specifies its rules completely enough that a stranger could reproduce it in an afternoon, which is more than can be said for almost anything posted on a chart. That is the standard. The finding is simply that the strategy those rules describe stopped working around the time the instruments to trade it were invented.
Method
Data: Ken French Data Library, 48 Industry Portfolios daily value-weighted returns and F-F Research Data Factors daily (RF, Mkt-RF), July 1926 – June 2026, 26,274 sessions. ETF prices: adjusted daily closes for 33 SPDR sector and industry funds, of which 25 have fifteen or more years of history; funds enter the universe on their listing date and take no risk budget before it.
Engine: bands computed on closing prices only. Entry compares today's close to yesterday's upper band. The trailing stop uses today's lower band and is never revised down. Position weights are set at the close and applied to the following day's returns, so no decision uses information it could not have had. Risk budget is divided by the number of assets available that day, not the nominal universe size.
Costs: leverage financed at the one-month T-bill rate in the paper's configuration and at 5.13% in the retail configuration. Friction charged in basis points of turnover; the 5bp case corresponds to roughly a half-cent spread on a $50 ETF plus commission.
Sources
Carlo Zarattini and Gary Antonacci, A Century of Profitable Industry Trends, SSRN 4857230 · Refining and Robust Backtesting of A Century of Profitable Industry Trends, arXiv:2412.14361 · Ken French Data Library · Concretum Group
Backtested results are hypothetical and do not represent returns any investor achieved. This is research, not investment advice.