

Issue 08 · 22 September 2026 · 4 strategies · 12 fixes · 13 years of 1-minute data
In Issue 01, four popular strategies failed our tests. We could have left them there. But a failed backtest sometimes hides a decent idea behind one bad rule, so we tried to fix each one before calling it dead.
We tried twelve fixes. Most did nothing. One brought a strategy back. Then we asked the question that matters for your account: would it have beaten simply owning QQQ?
One rescue works in the lab. On its own it trails QQQ. Added on top of QQQ it helps, but the evidence is borderline and weakens with every second of delay.
Method: 1-minute Nasdaq-100 data from October 2013 to August 2026, costs included, account-level returns against QQQ and SPY with dividends.
01 / THE FIXES
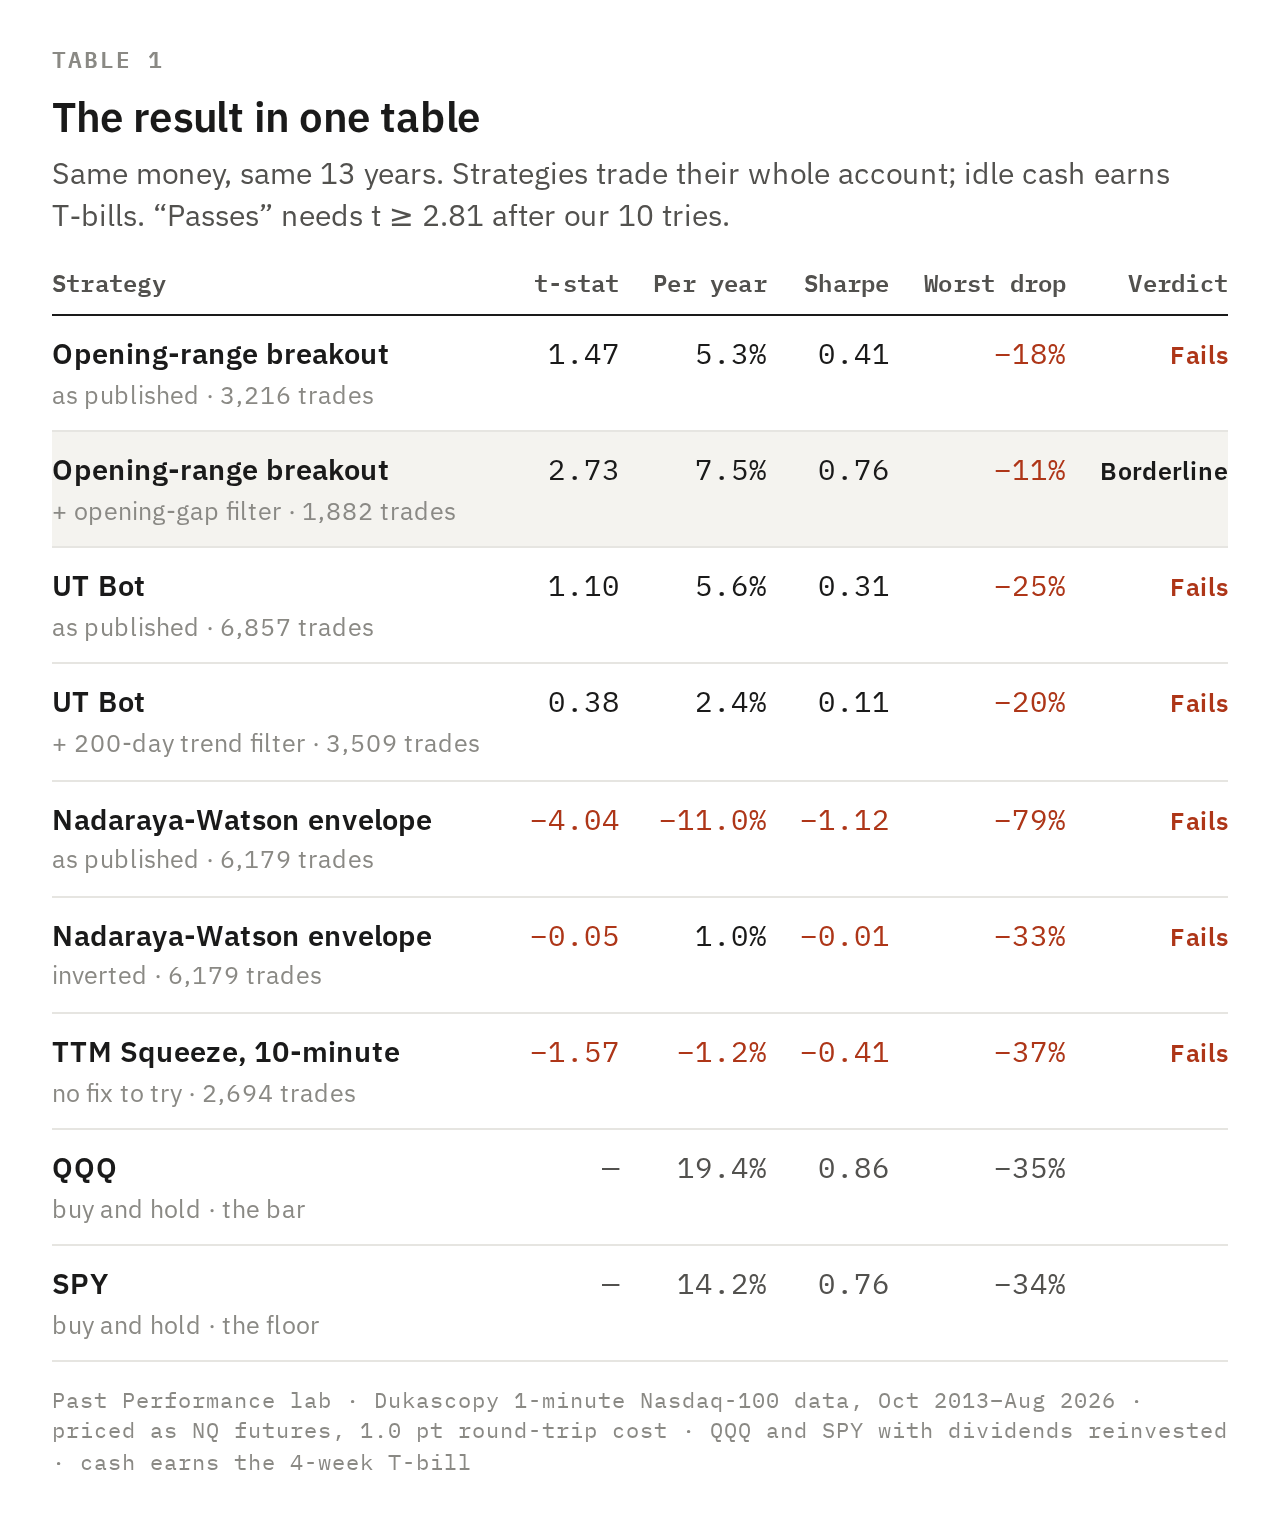
Three of the four could not be saved
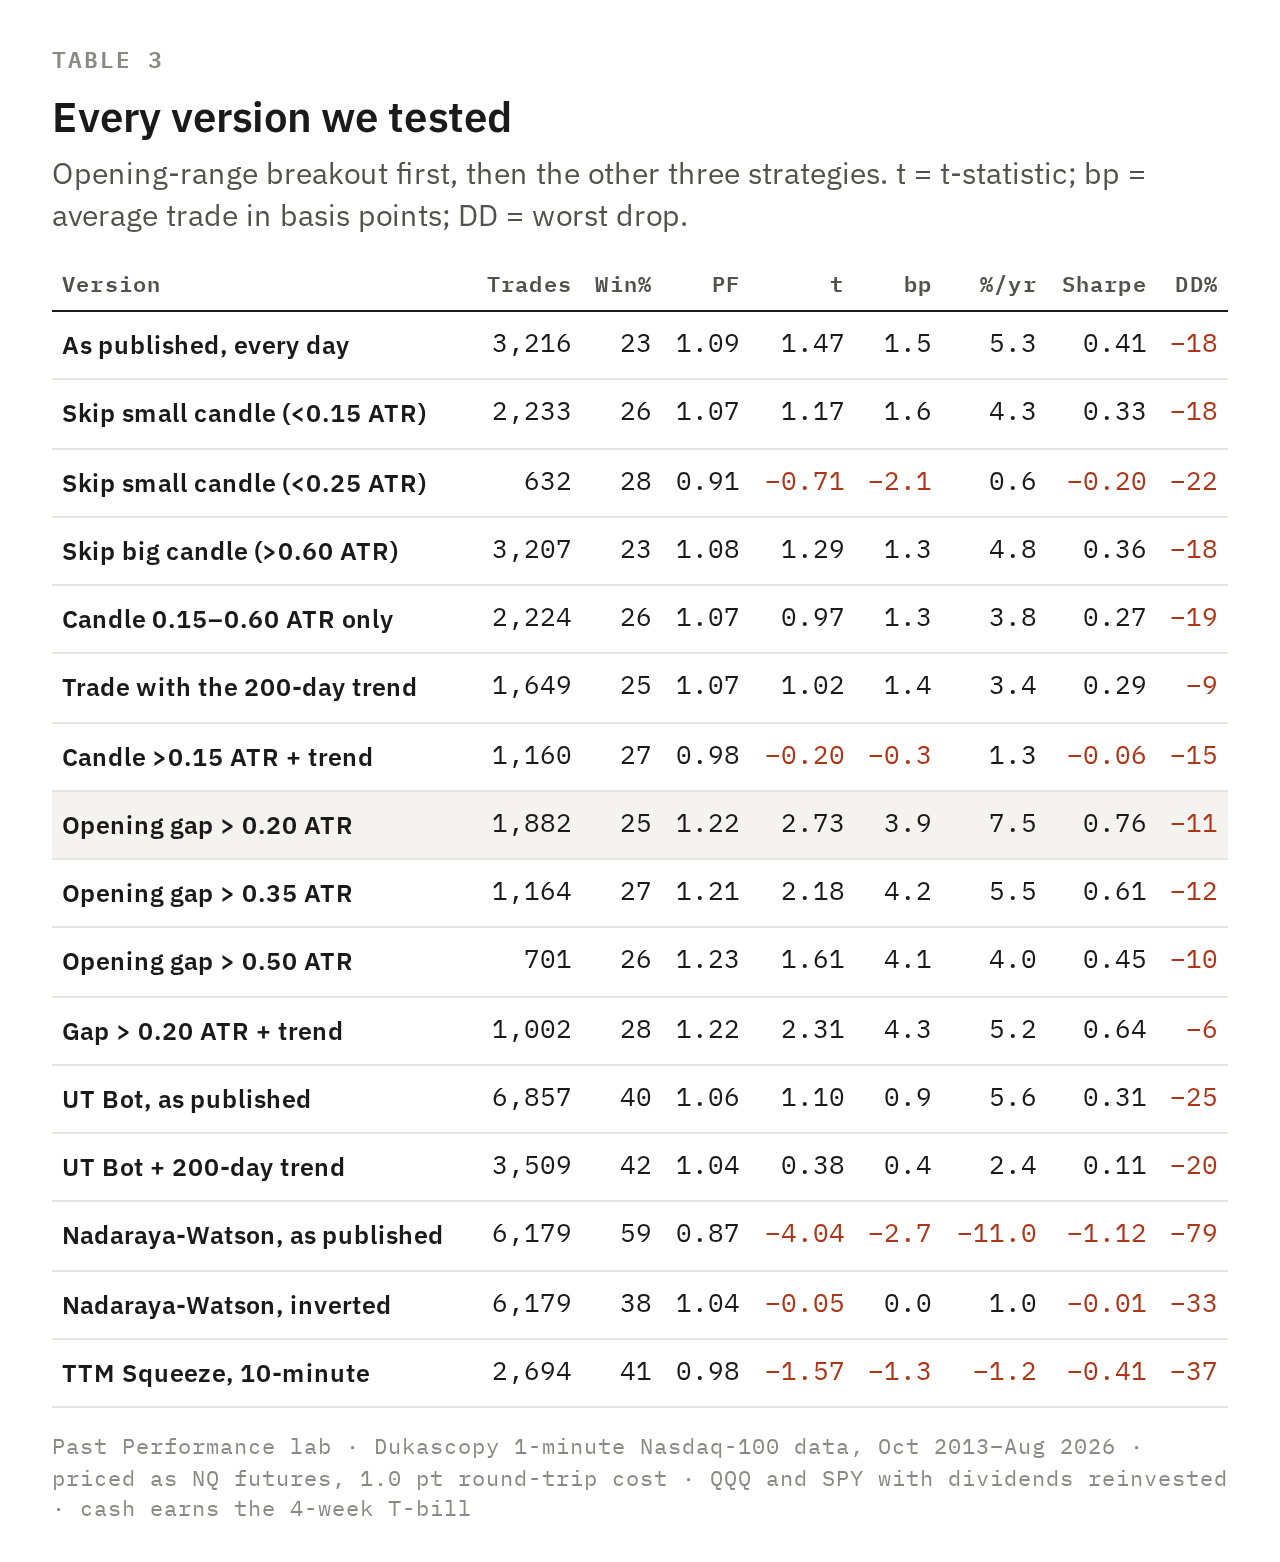
UT Bot. It flips long and short on an ATR trailing stop. We let it trade only with the 200-day trend. It traded half as often and earned less, because the filter threw out good and bad trades alike.
Nadaraya-Watson envelope. It wins most of its trades and still loses money, because its losers are bigger than its winners. The obvious fix is to flip it. Flipped, the average trade is zero after costs: a friction machine in both directions.
TTM Squeeze. There was nothing to fix. On 10-minute bars it has no edge to rescue. Use it, if at all, as one input to another signal, not as a strategy.
02 / THE ONE THAT WORKED
Only a gap filter lifted the breakout
The 5-minute opening-range breakout is simple. At 9:35 in New York, buy if the first 5-minute candle closed up and sell if it closed down. The stop sits at the other end of that candle, the target is ten times the risk, and anything still open goes at the close.
As published, it trades every day, and the edge is too thin to tell from luck. We tried ten versions. Filters on the size of the first candle did nothing, and neither did the 200-day trend. One idea worked: trade only on days that open with a gap of at least a fifth of a normal day's range. The average trade more than doubled.
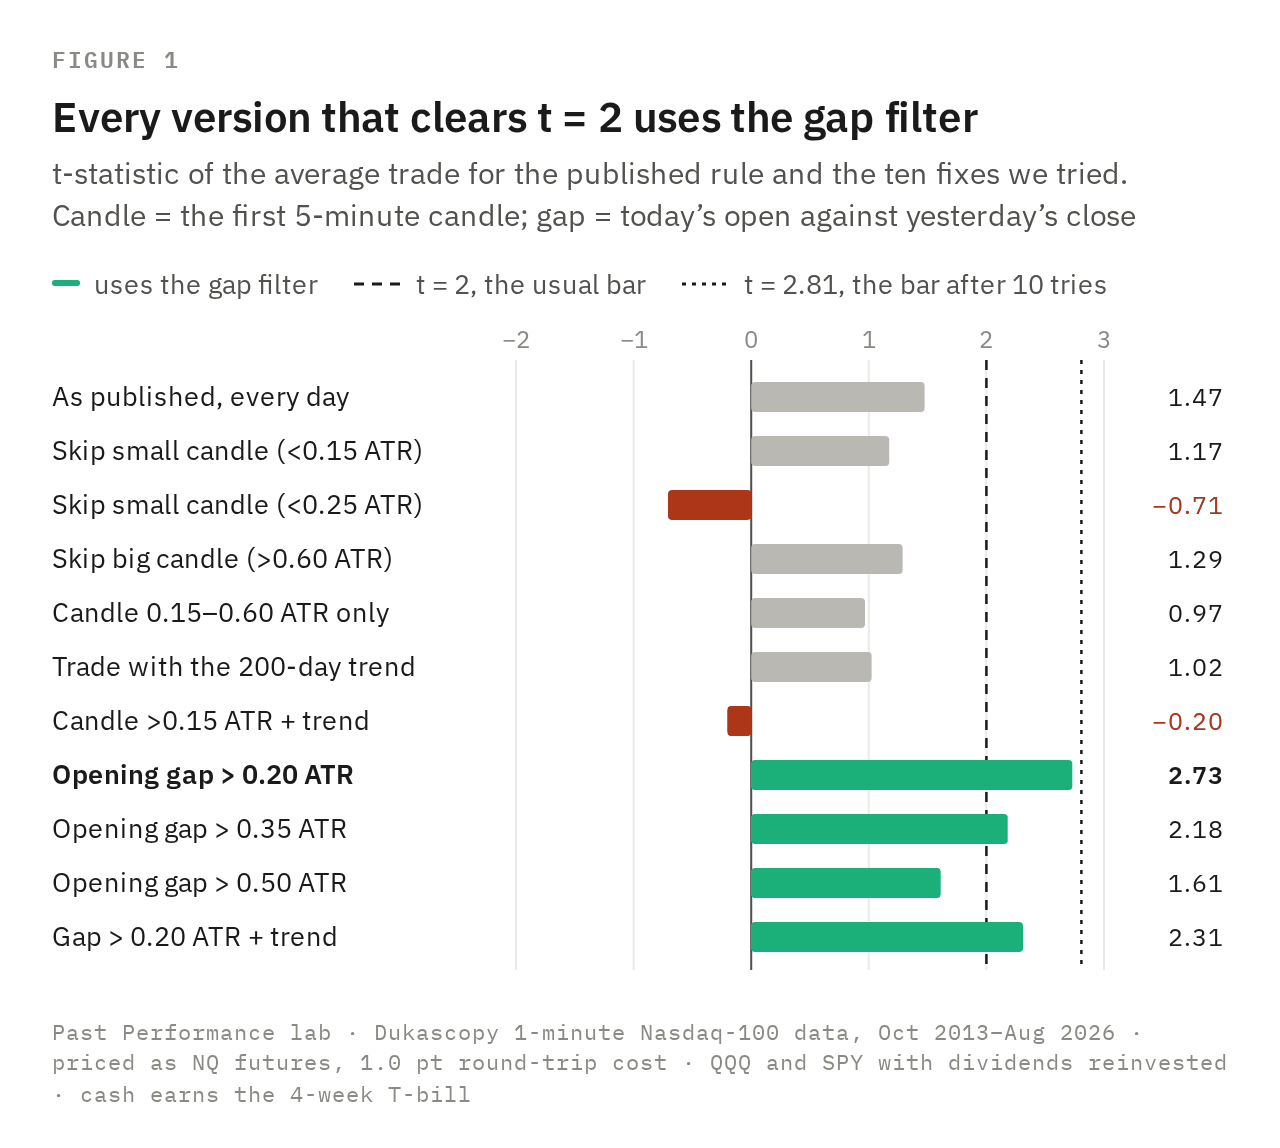
Here is the catch most backtests skip. Try ten versions and one will look good by chance. With ten tries, the bar for "probably not luck" rises from t = 2 to about 2.8. The gap filter reaches 2.7. Close, but not over.
03 / THE LUCK CHECK
It is not one lucky setting
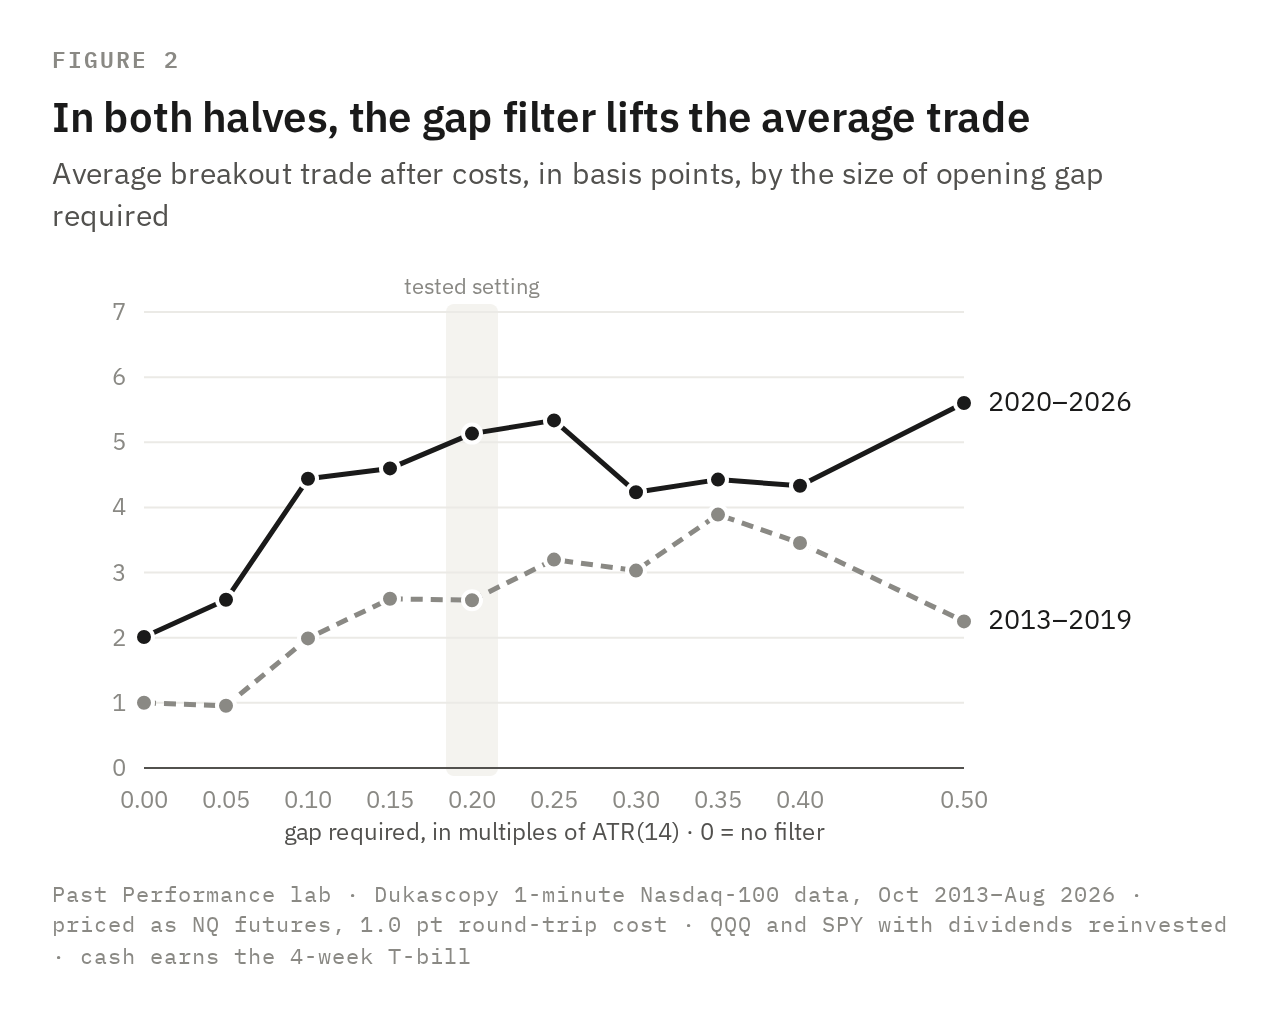
A lucky setting works at one value and nowhere near it. This one works across a range: any gap requirement from a tenth to a quarter of a normal day's range lifts the average trade.
The average trade is also positive in both halves of the data, 2013–2019 and 2020–2026. Most of the evidence comes from the second half.
04 / THE ACCOUNT
Alone it trails QQQ. On top of QQQ it pulls ahead
From this issue on, every verdict is measured at the account level against QQQ, the bar, and SPY, the floor: same money, same years, dividends included.
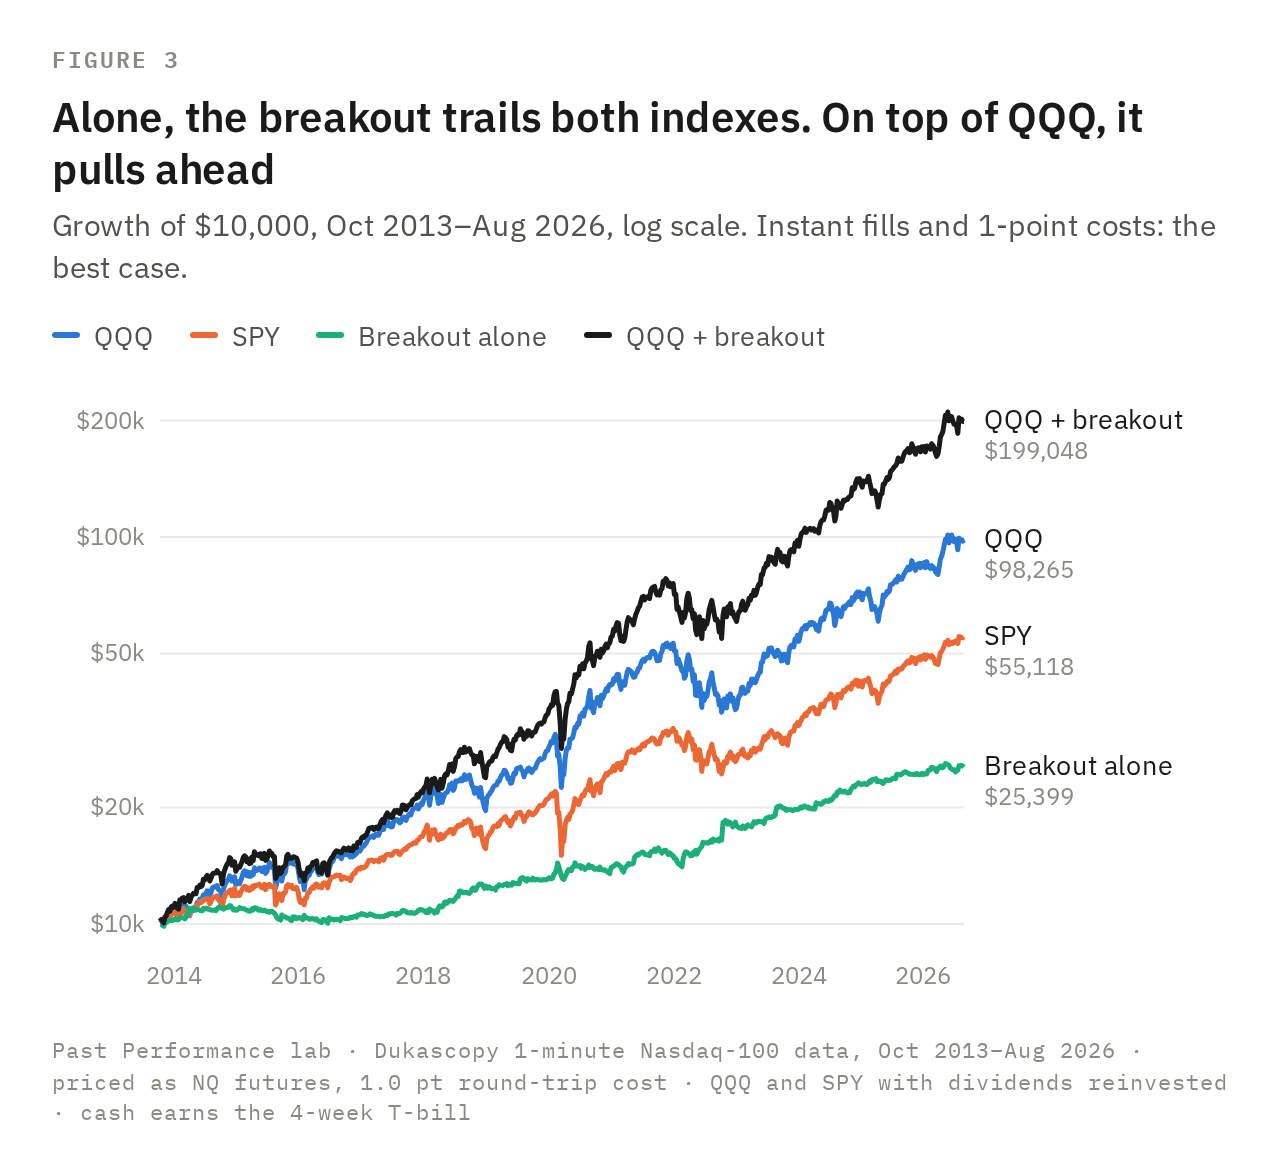
On its own, the rescued breakout turned $10,000 into a fraction of what either index made. It trades on about three days in five, and a typical trade lasts under half an hour. Meanwhile the account's cash earns T-bill interest.
But its returns do not move with the Nasdaq. It made money in 2018, when QQQ went nowhere, and in 2022, when QQQ lost a third. So we tested the version a futures trader could run: keep all the cash in QQQ and trade the breakout with futures on top. That account beat QQQ by several points a year, with a smaller worst drop.
05 / THE CATCH
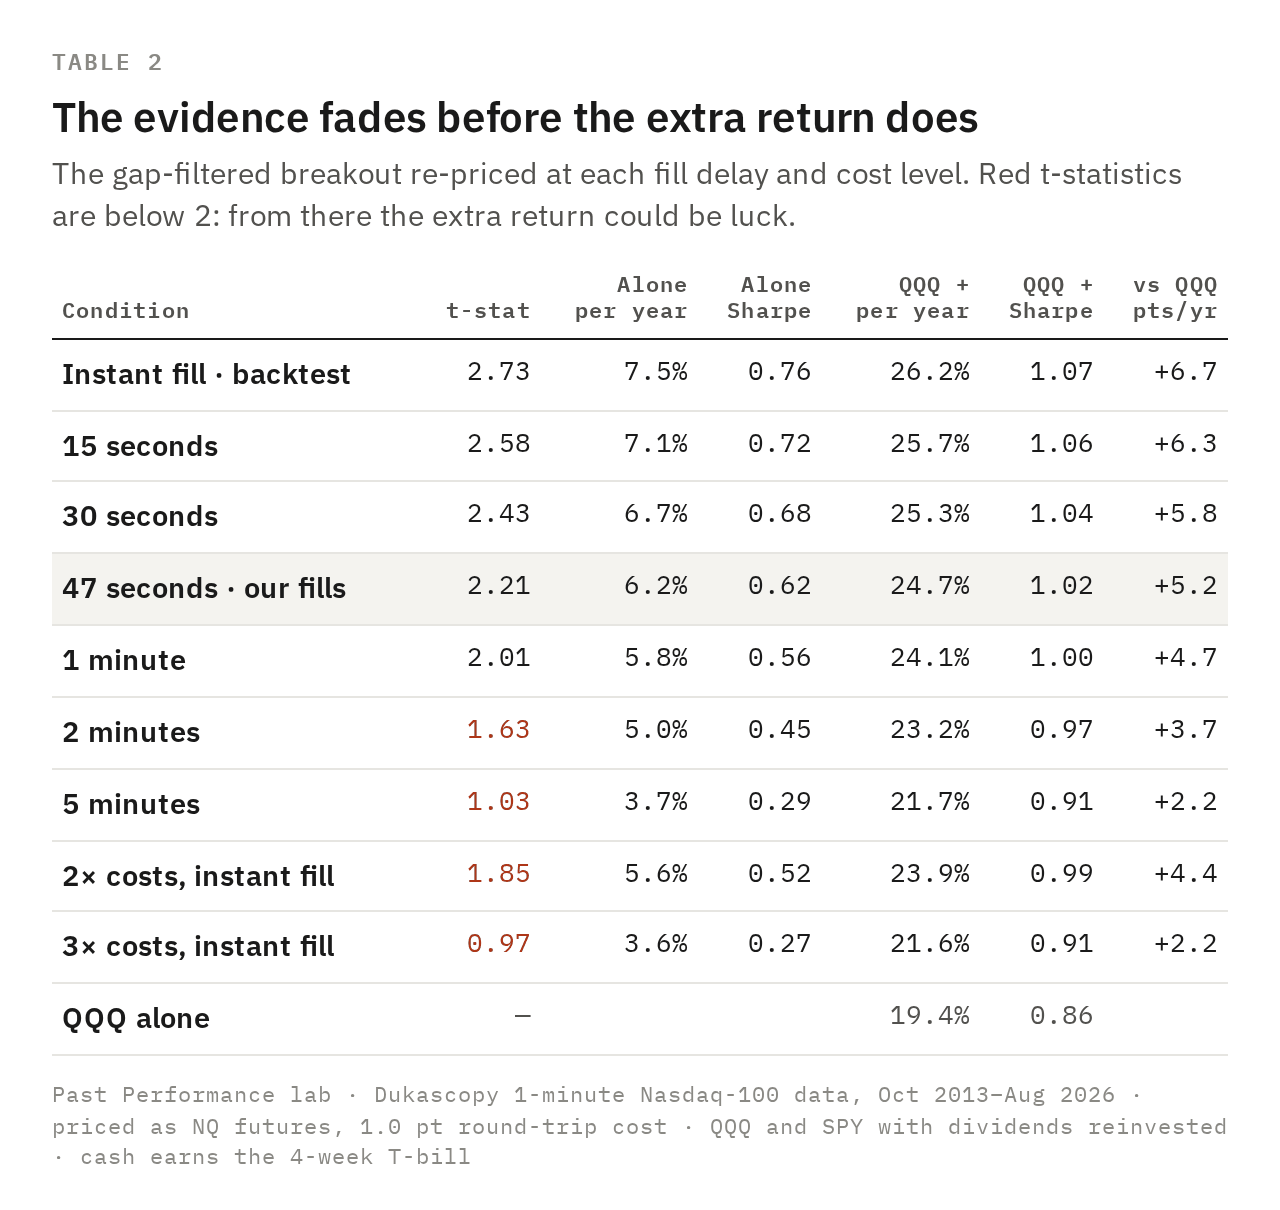
The evidence fades before the extra return does
Those are best-case numbers: instant fills and one-point costs. Our own automated orders fill about 47 seconds after the signal (Issue 07). At that speed the t-statistic drops to 2.2. At two minutes it is 1.6, and at double costs 1.9.
The add-on still shows extra return at every speed in the table. That is the trap. Any add-on that is uncorrelated with QQQ and positive on average lifts the backtest, even when that average is luck. The published breakout, the version that failed, would also have "beaten" QQQ as an add-on. What decides it is the evidence, and here the evidence is borderline at best.
The transferable part
Count your tries. Ten versions tested means the bar sits near t = 2.8, not 2.
Split the years and nudge the setting. A real filter helps in both halves of the data and at neighbouring values.
Test it against QQQ twice: alone and as an add-on. Then ask whether the add-on's own average survives real fills.
Your turn
Send us the strategy you are about to risk money on. Reply to this email or write to pastperformancelab@protonmail.com. We test it and publish what we find.
Method
Data. Dukascopy 1-minute Nasdaq-100 (US Tech 100) bid prices, 18 October 2013 to 28 August 2026, priced as NQ futures at $20 a point with a 1-point round-trip cost. Signals on the bar close, fills at the next bar's open. Delayed fills are re-priced on the same tape, as in Issue 07.
Calendar. Daily filters (ATR(14), the 200-day average) use NYSE trading days only, and trades on days the US market was closed are excluded. Issue 07 used the tape's own calendar and dollar t-statistics, which gave the gap filter t = 2.60; on NYSE days and percentage returns it is 2.73.
Account level. Each trade controls notional equal to the account. Cash earns the 4-week T-bill rate (FRED) every day. The add-on holds QQQ with all the cash and adds the strategy's trade returns. QQQ and SPY returns include reinvested dividends.
Statistics. t-statistics use per-trade percentage returns. The bar for ten tries is a Bonferroni-adjusted 5% two-sided threshold (t = 2.81).
Versions. UT Bot: a = 3, ATR 10, 10-minute bars, regular hours. Nadaraya-Watson: the non-repainting endpoint estimator, regular hours. TTM Squeeze: 10-minute bars, as in Issue 01.
Sources. 5-minute ORB: Carlo Zarattini and Andrew Aziz, Can Day Trading Really Be Profitable? (2023). UT Bot Alerts on TradingView. Nadaraya-Watson Envelope [LuxAlgo] on TradingView. TTM Squeeze: John Carter, Mastering the Trade.
Past performance is no guarantee of future results. We check anyway. This is research, not investment advice.