

Editor’s note, 3 September 2026. The Connors RSI(2) verdict in this issue was superseded the next day by Issue 05, The Winner That Doesn’t Win, which takes the strategy to the account level: per trade the edge is real, but in an account it makes 4.32% a year against buy-and-hold’s 10.86%. Read that issue first. The four failures here stand.
Verification Batch 01 · 1 September 2026 · 13.7 years · 1-minute bars
Popular trading strategies, reproduced from their published rules and run through the same pipeline on the same data. Four do not survive contact with costs, concentration, or a fair benchmark. One does — and its honest headline is smaller than its raw one.
Instruments. US Tech 100 · US 500
Window. 2013-01 → 2026-08
Bars tested. 11,766,240
Missing sessions. 0
The ledger
What each strategy actually returned
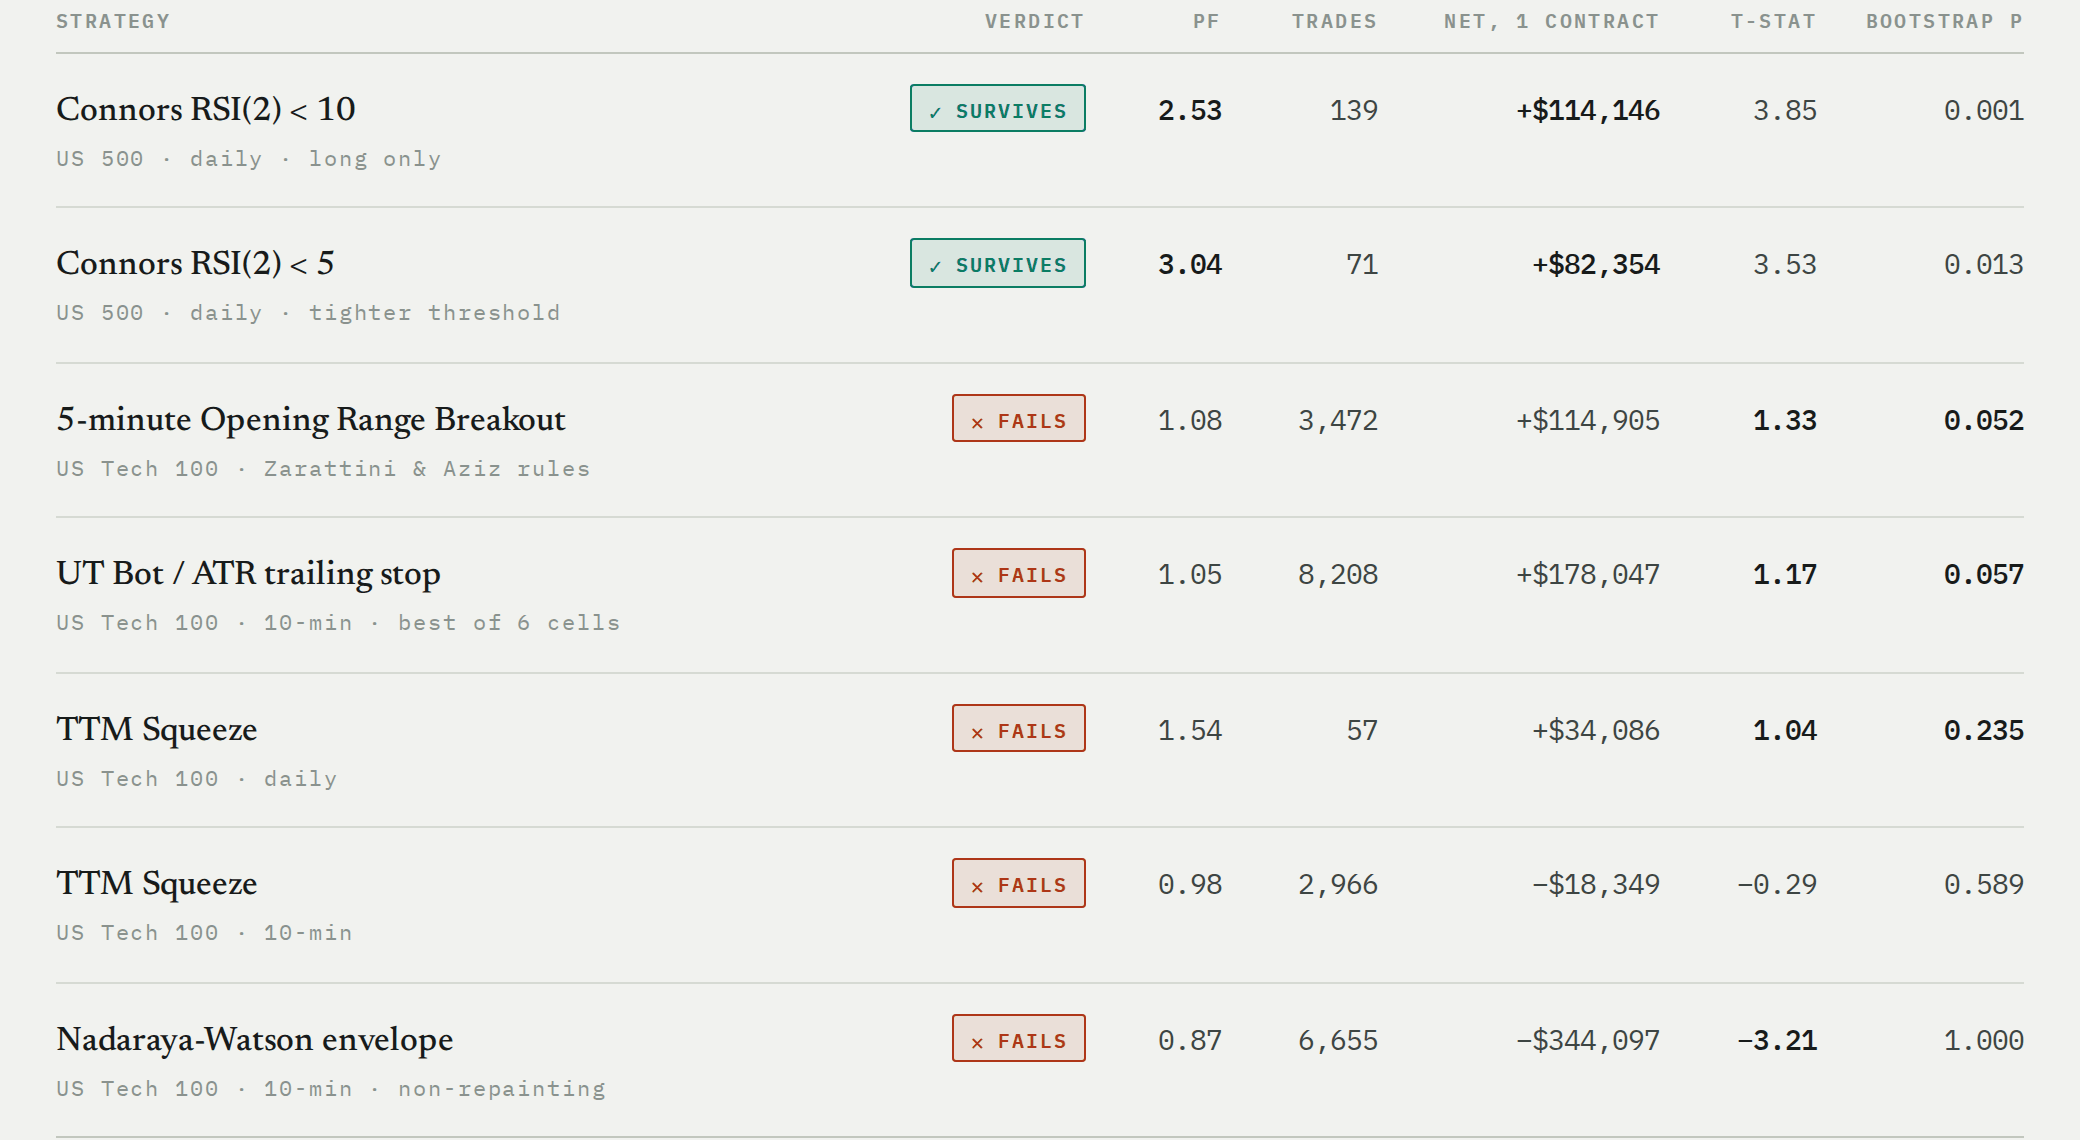
t-stat is on per-trade P&L. Bootstrap p is the share of 2,000 stationary-block resamples of daily P&L landing at or below zero. Net is one contract, no compounding, friction of 1 index point round trip on US Tech 100 and 0.3 on US 500.
Control
Why you should believe the failures
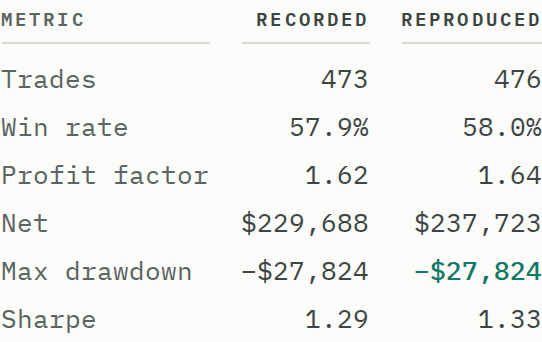
A pipeline that finds nothing is worthless if it would also find nothing in a strategy that works. So the first thing through it was a strategy already validated on a different engine, with a recorded result to hit — the Saty Phase Oscillator. This lab is new code on freshly downloaded data; it had to land on the old numbers independently.
Independent reproduction · Saty Phase Oscillator
It landed. Maximum drawdown matched to the dollar and net P&L to within 3.5%, from a separate download and a separately written engine. The suite was also run against synthetic random-walk data first: no strategy showed an edge, which is what rules out lookahead bias in the harness.
Cost sensitivity
How much friction each edge can absorb
Every strategy was re-priced at one, two and three times its assumed trading cost. The number below is the breakeven: the round-trip friction, in index points, at which the strategy's entire profit disappears. Anything close to real-world cost is not an edge, it is a rounding error that happened to land the right way.
Surviving cost is necessary but not sufficient — note that TTM Squeeze on daily bars tops this chart and still fails, because what kills it is concentration, not friction.
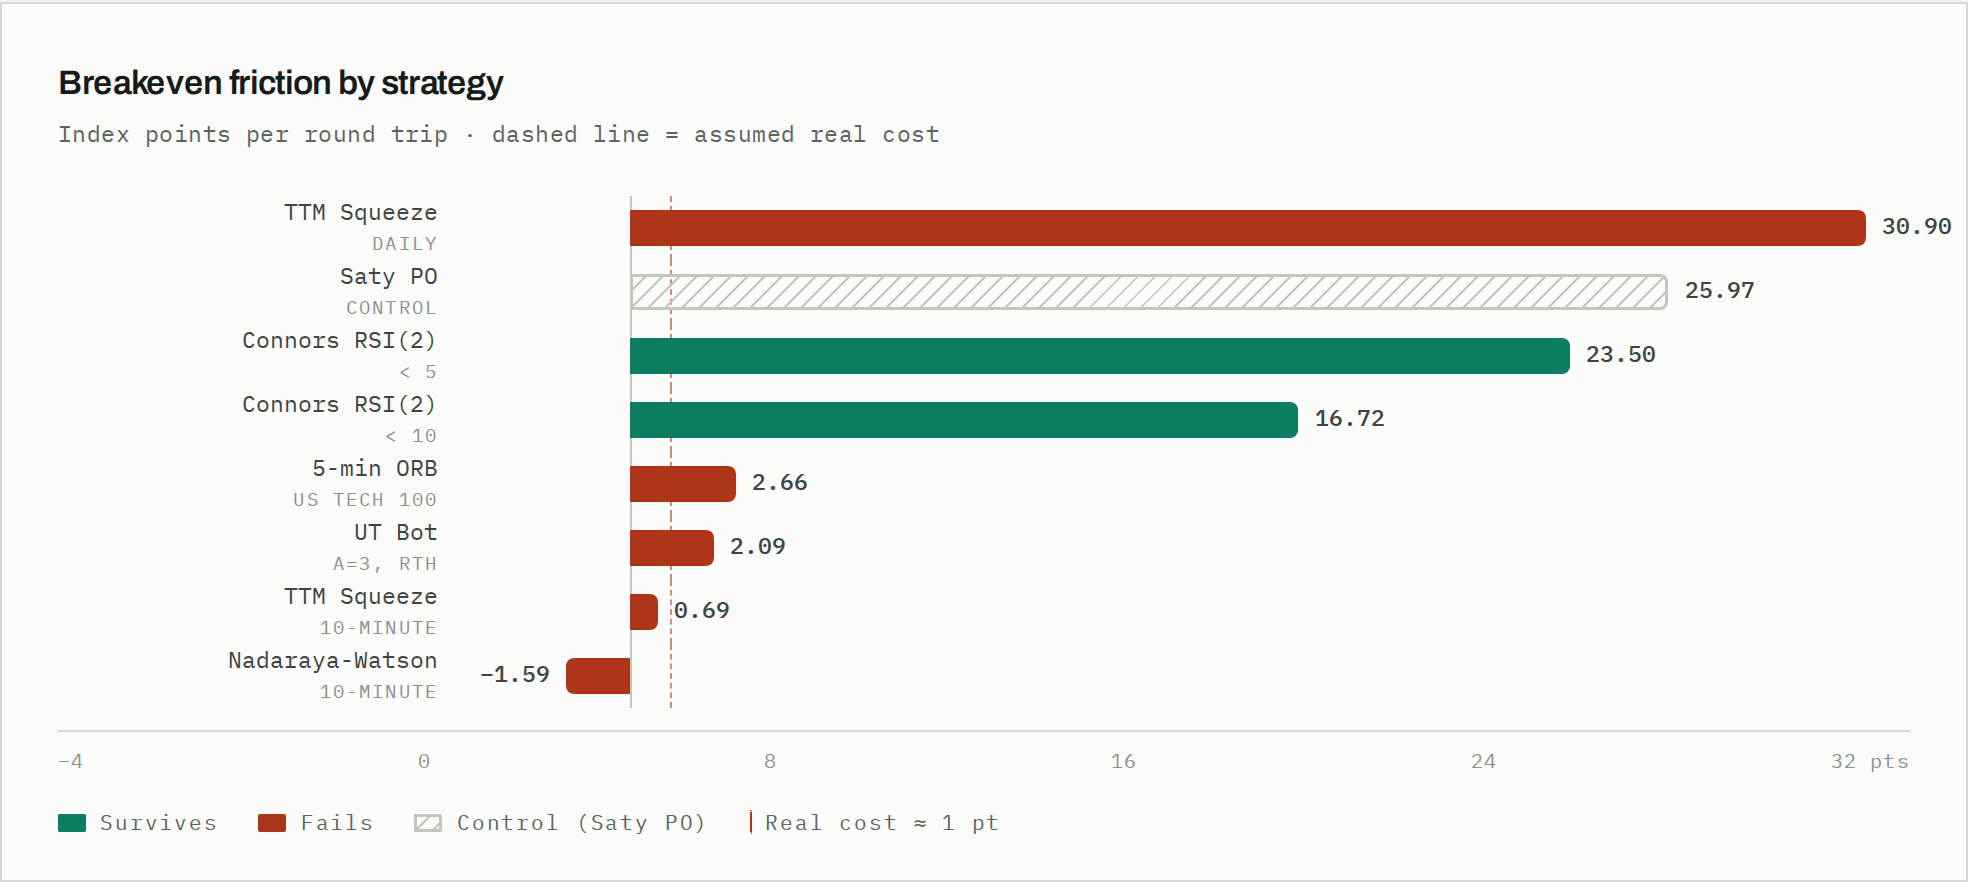
A negative breakeven means the strategy loses money even with zero trading cost.
Findings
What killed each one
Nadaraya-Watson envelope — Fails (significantly negative)
Win rate 58.4% · Net −$344,097 · t-stat −3.21 · Breakeven friction −1.59 pts
The cleanest negative result in the batch, and the most instructive. Nearly six trades in ten win — and it still loses a third of a million dollars per contract. The breakeven friction is negative, meaning it loses money at zero trading cost; the losers are simply far larger than the winners.
This is the single most useful thing on the page for anyone evaluating a strategy from a screenshot: win rate is not edge. A high win rate is the easiest statistic to show and the least informative one to see. Tested here in its non-repainting form, which is the honest version — the popular default repaints, and repainting flatters every backtest that includes it.
TTM Squeeze — Fails (daily and 10-minute)
PF, daily 1.54 · Top 5 trades 160% of net · Losing years 7 of 14 · PF, 10-min 0.98
On 10-minute bars it is nothing at all: profit factor 0.98, t-stat −0.29. On daily bars a profit factor of 1.54 looks respectable, until you notice the top five trades account for 160% of the net profit — everything else, combined, loses money. Seven of fourteen years are negative and the t-stat is 1.04.
Fifty-seven trades across nearly fourteen years is not a track record, it is a small sample with a good anecdote attached.
UT Bot / ATR trailing stop — Fails (six parameter cells tested)
Best cell PF 1.05 · Worst cell net −$999,362 · Trades, worst cell 58,444 · Breakeven friction 2.09 pts
A friction machine. The aggressive setting takes 58,444 trades over the window and loses just under a million dollars per contract — the strategy is not wrong about direction so much as it is billed to death. The best of the six cells reaches profit factor 1.05 with a t-stat of 1.17, which is indistinguishable from zero, and 59% of that profit sits in five trades.
At twice the assumed cost the best cell is already at breakeven. Sensitivity to a parameter you chose after seeing the results is the definition of a curve fit.
5-minute Opening Range Breakout — Fails (no demonstrable edge)
PF 1.08 · t-stat 1.33 · Top 5 trades 52.6% of net · 2026 YTD −$15,384
Marginally positive on index futures and statistically indistinguishable from zero. The top five trades are more than half of all profit, the best single year is another 37.5% of it, five of fourteen years lose money, and the strategy is down on the year as of testing.
It survives cost better here than in its original form because index futures are cheap to trade relative to their point value. The published version is on QQQ shares, and an independent replication of that paper reports the result collapsing from $138,639 to $4,860 — Sharpe 1.06 down to 0.23, worse than buy-and-hold — once two cents per share of slippage is applied. The edge lives inside the spread.
Connors RSI(2) — Survives (the one that holds up)
PF 2.53 · t-stat 3.85 · Breakeven friction 16.7 pts · PF at 3× cost 2.45
It survives, and it survives on the dimensions that usually break things. The t-stat is 3.85 with a bootstrap p of 0.001. Breakeven friction is 16.7 points round trip against a real cost near one, so tripling the cost assumption moves profit factor from 2.53 only to 2.45. The profit is not concentrated — the top five trades are 27% of net, against 52% and 59% for the strategies above — and only three of thirteen years lose money.
Which brings us to the part that a chart of the equity curve would quietly leave out.
The caveat
Connors does not beat buy-and-hold
Connors RSI(2) is a long-only dip-buyer, tested across thirteen years in which the index roughly quadrupled. The benchmark that matters is not zero, it is owning the thing.
✕ “Connors RSI(2) returned $114,146 per contract.”
True, and misleading. Buy-and-hold over the same window returned $294,260 — more than double.
✓ “Roughly 3× the return per unit of market exposure, at a fifth of the drawdown.”
The strategy is in the market 12.8% of the time. Exposure-matched, buy-and-hold returns $37,587 against Connors' $114,146. Worst drawdown −$12,875 against −$60,978.
Stated in the same breath, not the footnotes
Two further limits belong with any use of this result. Entries and exits are taken at the signal day's close, which assumes you can transact at the close — a real implementation will not match the backtest exactly. And the test runs on a CFD proxy for the index rather than the cash instrument.
None of that makes the edge disappear. It does mean the honest claim is narrower than the raw number, and anyone printing the raw number beside an equity curve is misleading by omission.
Method
How to check this
Data
Dukascopy 1-minute bid bars, 2013-01-01 to 2026-08-31, downloaded and then gap-repaired until zero weekday sessions were missing: 6,134,400 bars across 4,260 sessions on US Tech 100, and 5,631,840 bars across 3,911 sessions on US 500. The binary decoder's field order was validated at 100% open-high-low-close consistency rather than assumed.
Conventions
Identical across every strategy, and identical to the engine used for the control: the signal is evaluated on the bar close, the fill is taken at the next bar's open, day strategies are flat at 16:00 ET, and indicators use Pine-compatible seeding so that a TradingView reader sees the same values. Friction is 1 index point round trip on US Tech 100 and 0.3 on US 500, swept at 1×, 2× and 3×.
Checks run before any result was read
The full suite was executed against synthetic random-walk data, where no strategy should show an edge. None did. Trade-accounting invariants were asserted mechanically: entry windows respected, no overnight holds in day strategies, points/dollars/friction internally consistent, and stop-loss exits never recorded as profitable.
Reproducing it
Engine, verification pass, data loaders and per-strategy trade logs live in /root/stratlab, kept separate from the live paper-trading service. Every number on this page traces to out/results.json or out/verify.json.
Verification batch 01 · seven configurations tested across five strategies · one survivor, stated with its caveats.
Results are historical simulation on proxy data and are not investment advice.