

Verification Batch 02 · SPX weekly put credit spread · 2 September 2026
The Milk Man published a complete SPX strategy — 95.4% win rate, $4,605 maximum drawdown, every rule stated. We reproduced his win rate to within a tenth of a point. Then we ran the same rule over thirteen years instead of six, and found that three of the four worst weeks in that history sit just outside his start date.
Survives · Risk understated 5–10×
The claim
One spread a week, at one level
The Milk Man (@MrMilkTrading) posted it in full: "Sell one SPX put credit spread per week at the Multi-Day Saty ATR −1 level. That's the whole strategy." Reported: 326 trades since May 2020, 95.4% win rate, profit factor 2.48, +$53,328 on a single contract, maximum drawdown $4,605.
His own site fills in the rest, and we used it: 50-point spread width, weekly SPXW expiry, entry on the first trading day of the week around 10:00 ET, short strike rounded to the nearest 5, average credit $298, $2.64 commission, hold to settlement with no stop and no adjustment. Maximum risk per lot, about $4,702.
The level resolves exactly from the indicator's open source: Multi-Day means the weekly timeframe, and the −1 level is the previous weekly close minus the weekly 14-period ATR. That is fully reproducible, which is more than can be said for most strategies that circulate with numbers attached.
It also makes the first check free. A spread held to expiry either settles above the short strike, keeping the whole credit, or below it, losing up to the width. Deciding which happened needs only the index and the strike — no options data at all.
First finding
His win rate is honest

This deserves to be said before anything else. The number reproduces. The same author's Phase Oscillator strategy also reproduced when we tested it, to within 3.5% on net profit with an identical maximum drawdown. He publishes figures that survive checking, which in this corner of the internet is unusual enough to be worth stating plainly.
Second finding
A 95% win rate here is arithmetic, not skill
A put credit spread wins whenever the index fails to fall past the strike. Placed one weekly ATR below the market, that is supposed to happen about ninety-five times in a hundred. The win rate is the design of the instrument, not evidence of an edge in it.
Decompose his own published figures and the shape becomes clear.

Everything therefore depends on the losses staying rare and staying apart. His stated worst case is a single maximum loss — so the claim is, in effect, that two bad weeks never landed close together. In February 2020 three landed inside four weeks.
Third finding
The start date is doing the work
Run the identical rule from 2013 rather than May 2020 and the picture changes — not catastrophically, but materially, and in the place that matters.
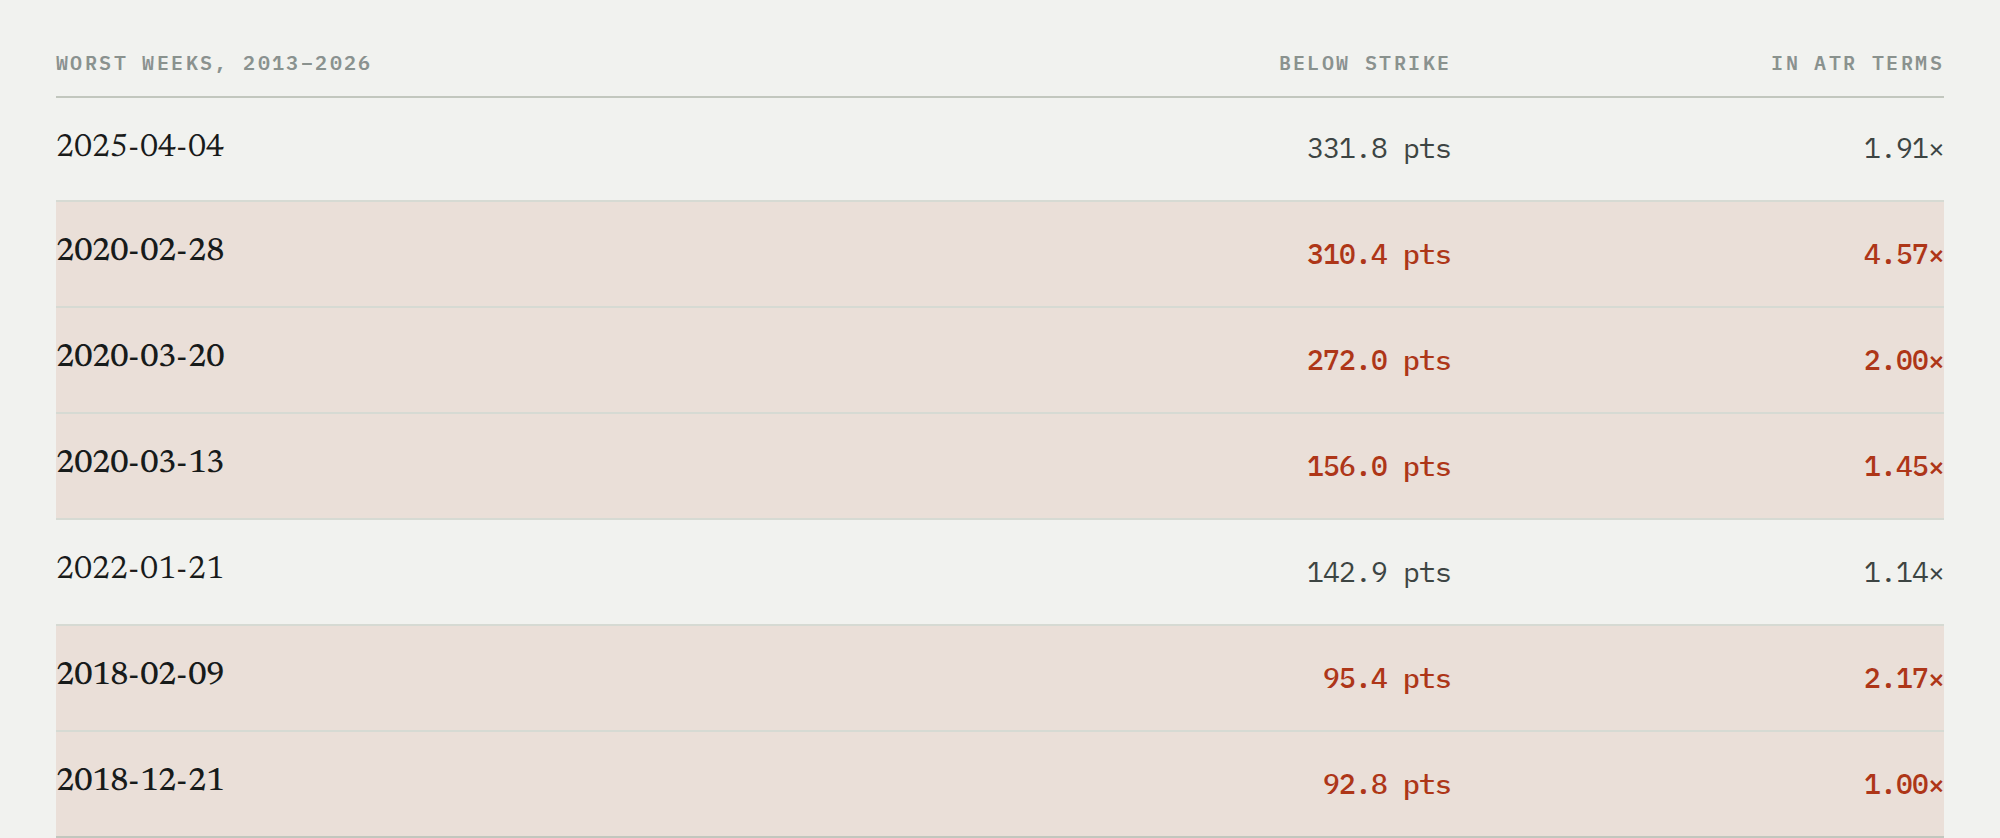
Shaded rows fall outside the tested window. The short strike sits at 1× ATR — a 4.57× ATR week is not a tail the position size contemplates.
The finding
Three of the four worst weeks in thirteen years fall in February and March 2020 — the ten weeks immediately before the backtest begins. A May 2020 start date excludes the single worst cluster for a short-put strategy in modern history, and misses it by six weeks.
Priced out
What it looks like over thirteen years
To put money on the outcomes we need the credit received, and that is the one thing the index alone cannot tell us. Rather than model option prices and inherit the model's errors, we used his own stated average of $298 a week. Using the author's number is more defensible than any pricing model we could build, and it is generous to him, because that credit was earned in the window he chose. No options data was purchased for any of this.
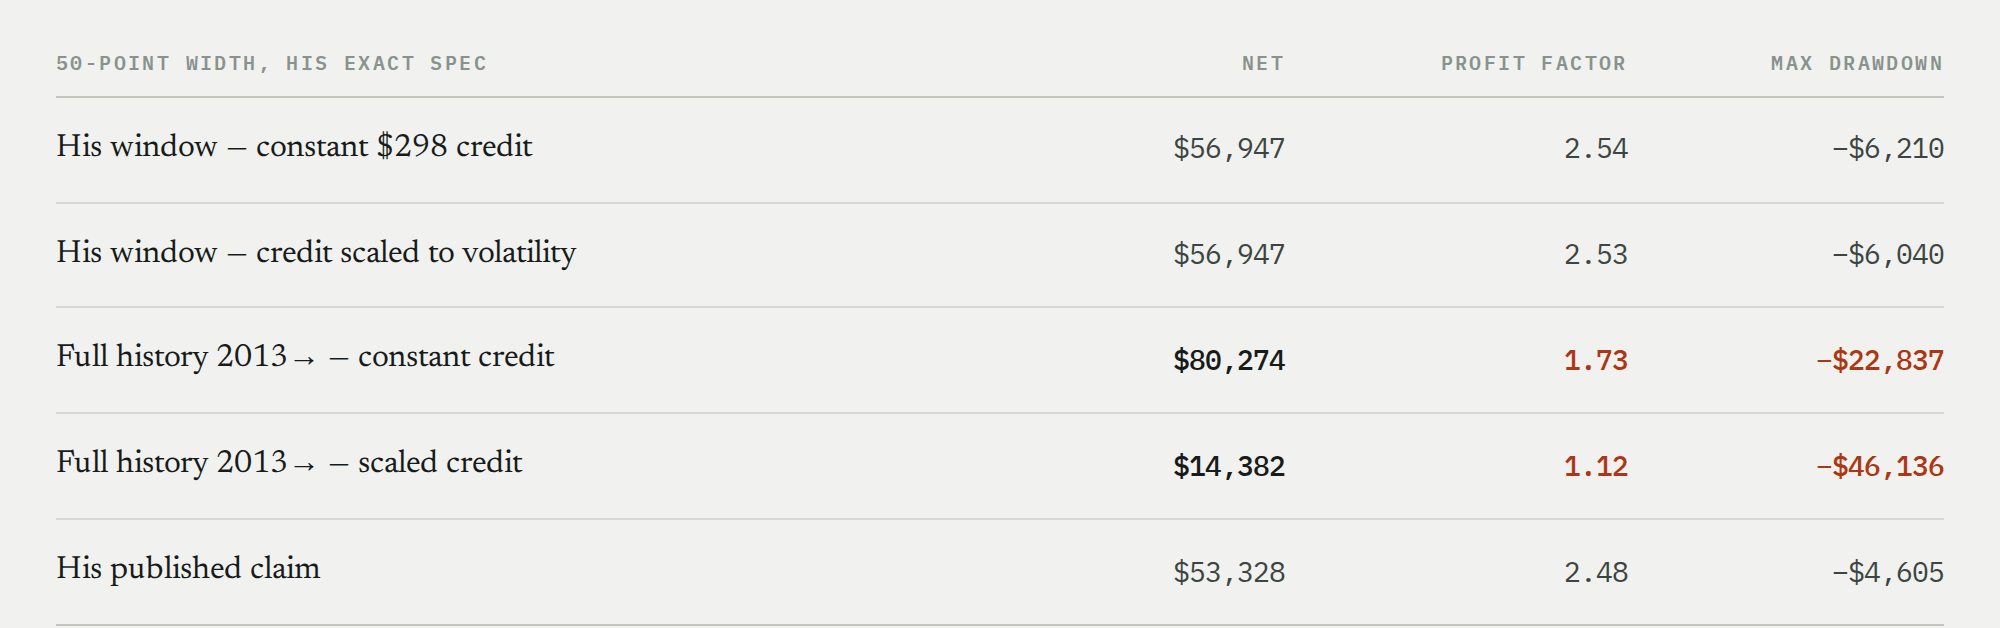
Our reconstruction on his own window comes out better than his own reporting (PF 2.54 against his 2.48), so this is not a lowball. Two credit models bracket the truth: a flat $298 every week overstates premium in calm markets, while scaling credit to prevailing volatility probably understates it. Reality sits between them — and both land far below his window. Profit factor falls from ~2.5 to between 1.73 and 1.12; maximum drawdown grows from about $6,000 to between $22,837 and $46,136, five to ten times the published figure.
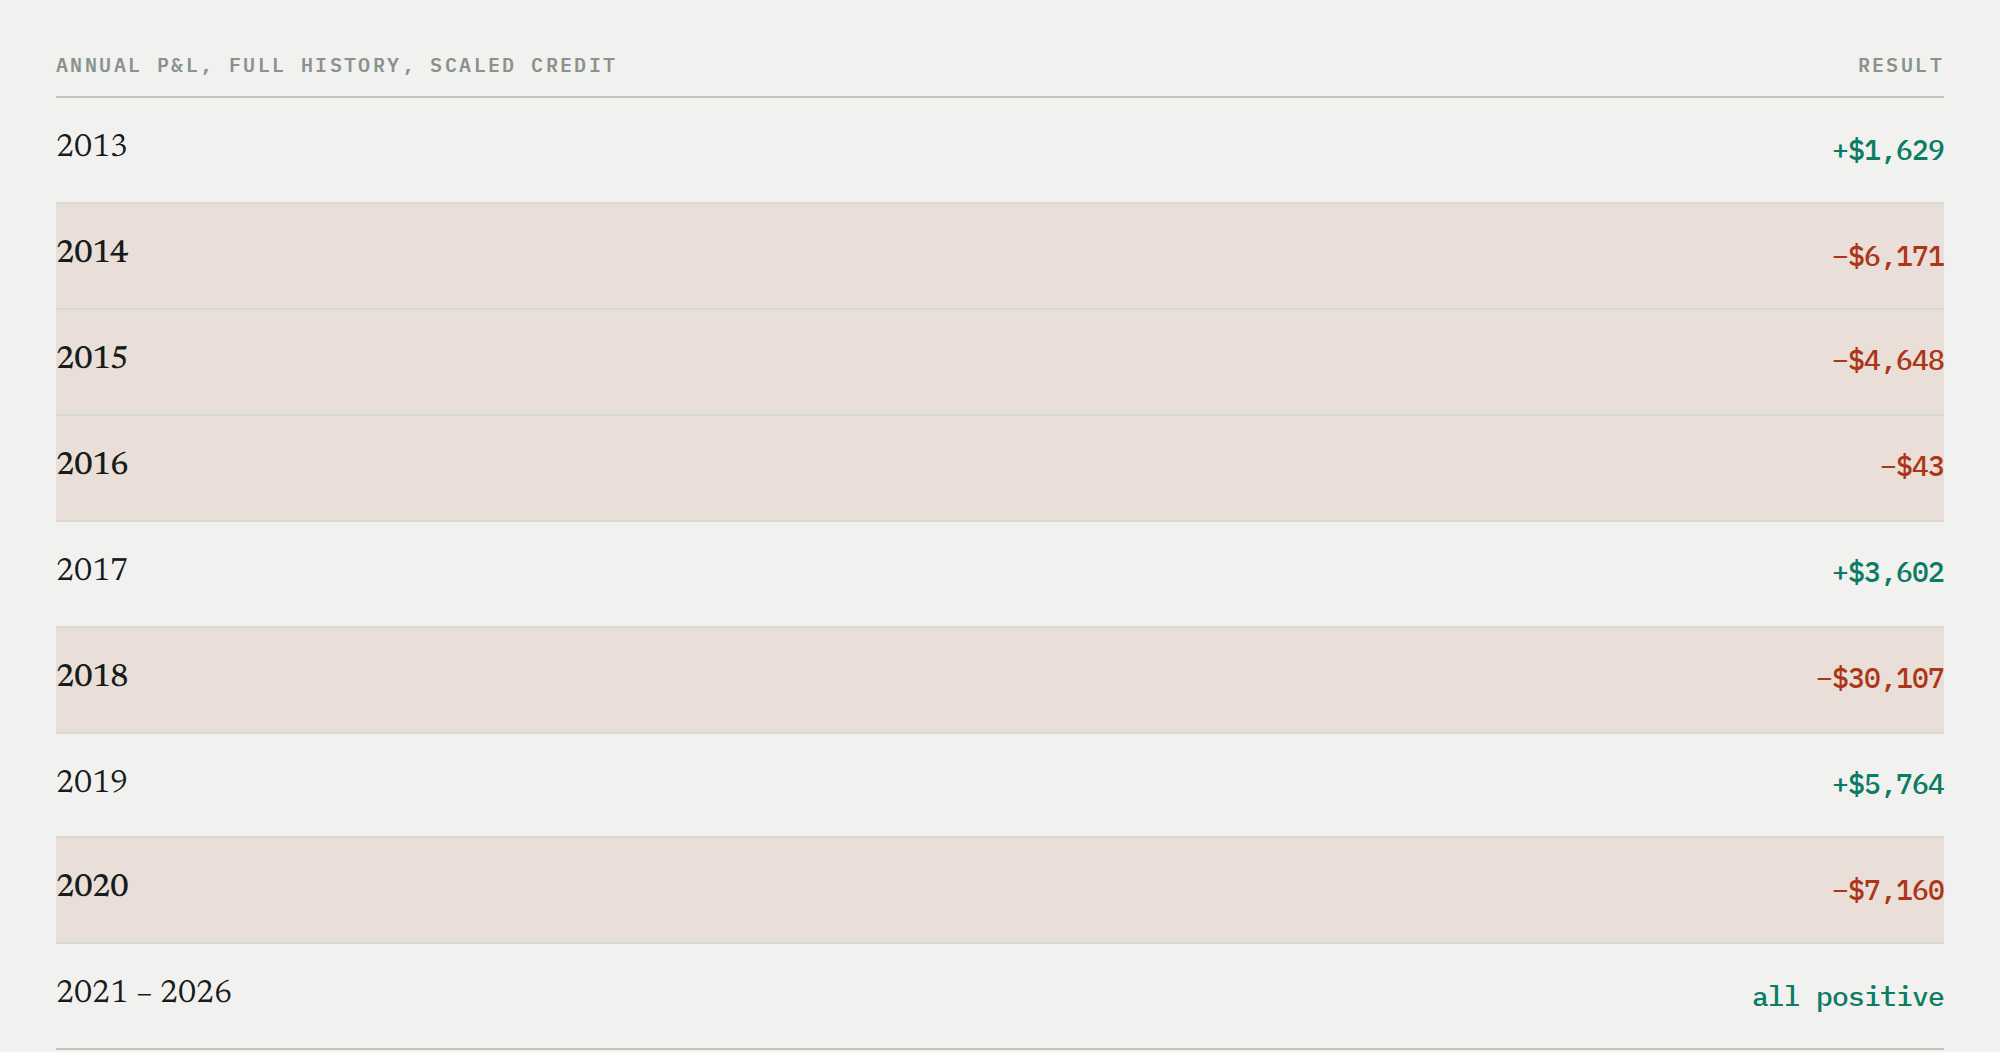
His site reports zero negative years across 2020–2026, and on his window we agree — zero of seven. Over the full history it is five negative years of fourteen. 2018 alone loses $30,107, and 2018 is entirely outside the tested period.
The mechanism
You are paid least exactly when the risk is greatest
The most useful thing in this whole exercise is not the drawdown number. It is the week-by-week shape of early 2020, which shows how strategies like this fail rather than merely that they can.
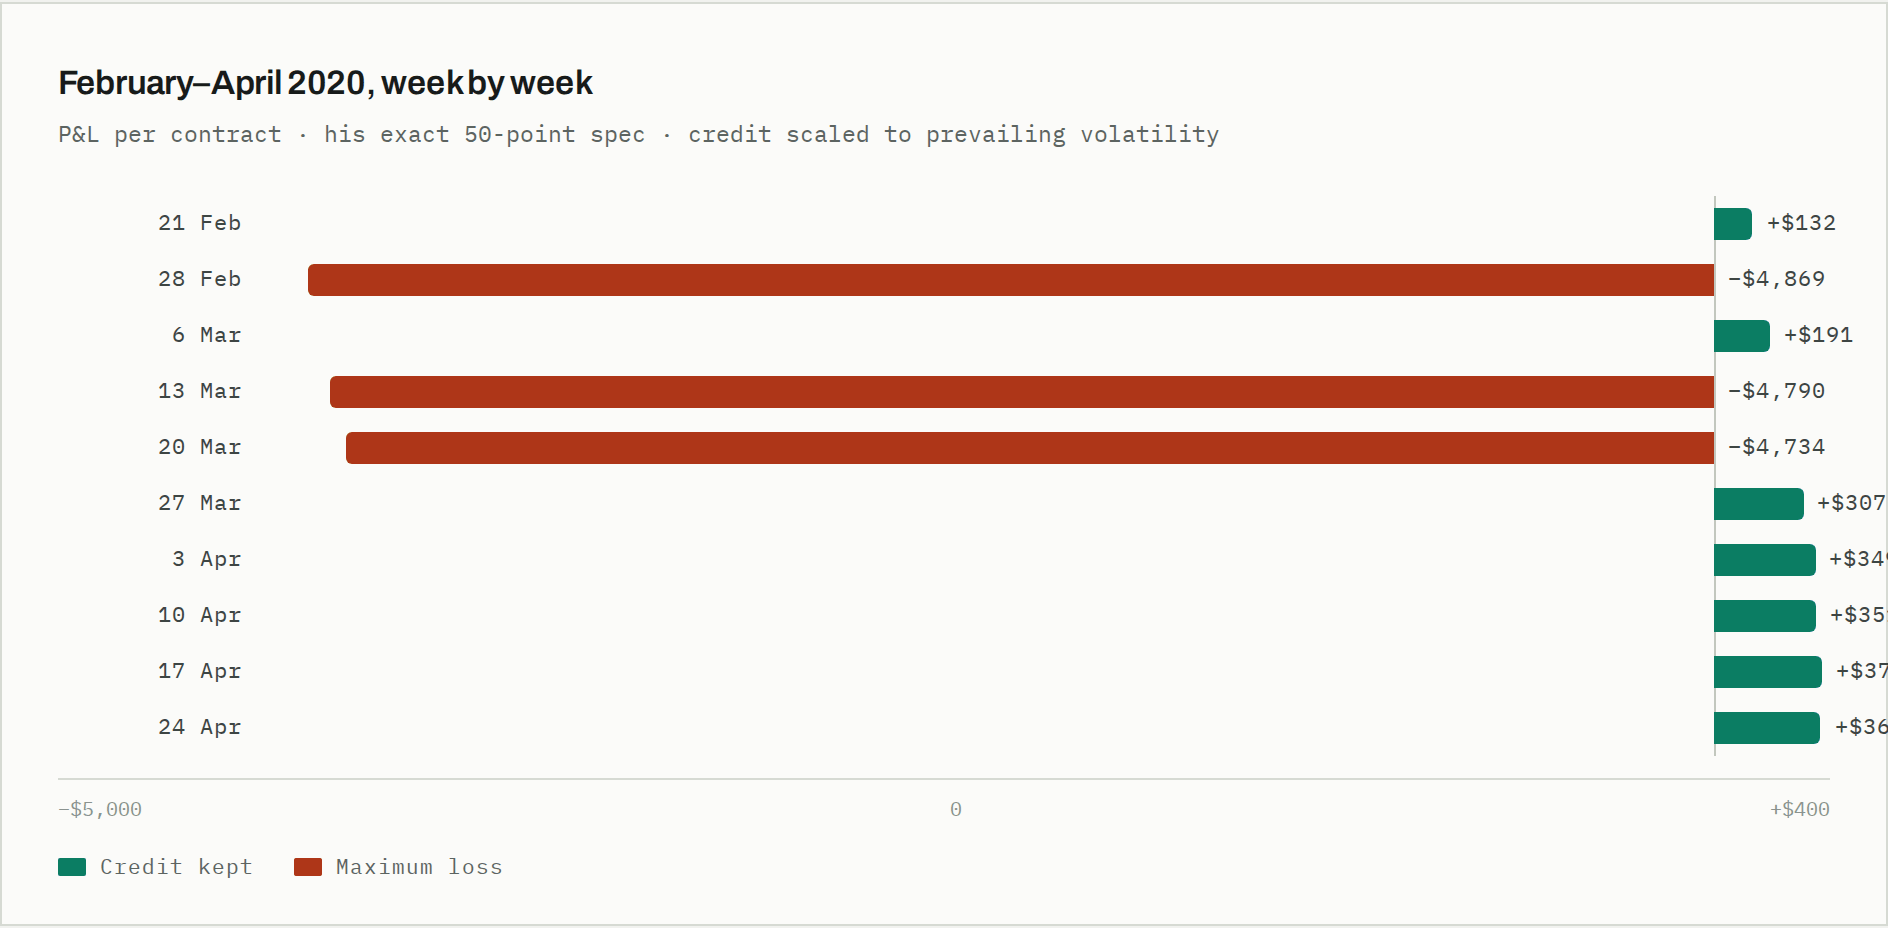
The credit collected going into the crash was $134. The credit collected a month later, once the damage was done and volatility was enormous, was $375 — nearly triple, for weeks that all won comfortably.
Premium scales with volatility, and volatility is low right up until it isn't. So you are paid the least for taking the risk precisely when the risk is greatest, and paid the most afterwards, when the danger has passed. That is not misfortune. It is the defining structural property of selling volatility, and no amount of backtesting inside a calm window will reveal it.
One quarter
February to April 2020 nets −$12,067 on a single contract: three maximum losses in four weeks, each about $4,800. One quarter loses more than twice the entire claimed lifetime maximum drawdown.
Fairness
What this is not
Not a dishonesty finding
He disclosed the start date, published every parameter down to the commission, and put the full specification on his own site. His arithmetic is sound and his win rate reproduces. He published a rule complete enough for a stranger to test — which is precisely why it could be tested at all. Most strategies that circulate with numbers attached cannot clear that bar, and the ones that cannot are the ones to worry about.
The criticism is narrower and it is about method, not character: six years is too short to price the tail of a strategy that earns small amounts often and loses large amounts rarely, and this particular window opens six weeks after the event that would have defined it.
Method
How to check this
Rule
Short strike = prior weekly close − weekly ATR(14), from the indicator's published source. Taken from his own published specification, not assumed: 50-point width, weekly SPXW expiry, entry first trading day around 10:00 ET, strike rounded to the nearest 5, hold to settlement, no stop or adjustment, $2.64 commission, skip the week if the natural credit is not positive.
Data and pricing
Index history 2013–2026 from a gap-repaired 1-minute dataset resampled to weekly bars. No options data was purchased. The credit is the author's own stated $298 average, applied both as a constant and scaled to prevailing volatility, which brackets the realistic range.
Retail implementability — 9 / 12
Weekly cadence, one liquid instrument, a single defined-risk order, ten minutes a week. Marked down for requiring options approval for spreads, and for demanding the discipline to accept a 16-to-1 loss-to-win ratio without intervening — and for a real drawdown that needs far more capital than the $4,605 figure implies.
Why we will not paper-trade it
A six-month paper run would show roughly 95% wins and prove nothing — it would reproduce the exact flaw identified here. A strategy cannot be validated over a horizon shorter than the frequency of the losses that define it.
Historical simulation on index data with modelled option credits; not investment advice. Batch 02 of an ongoing verification series.