

Issue 11 · October 2026 · 182 SPY trades, 142 QQQ trades, 33 years
Two moving averages cross, price dips back, and you buy the first pullback. Justin Banks calls the 8/21 EMA setup the strategy that "will help you retire", and it is a widely shared swing-trading rule.
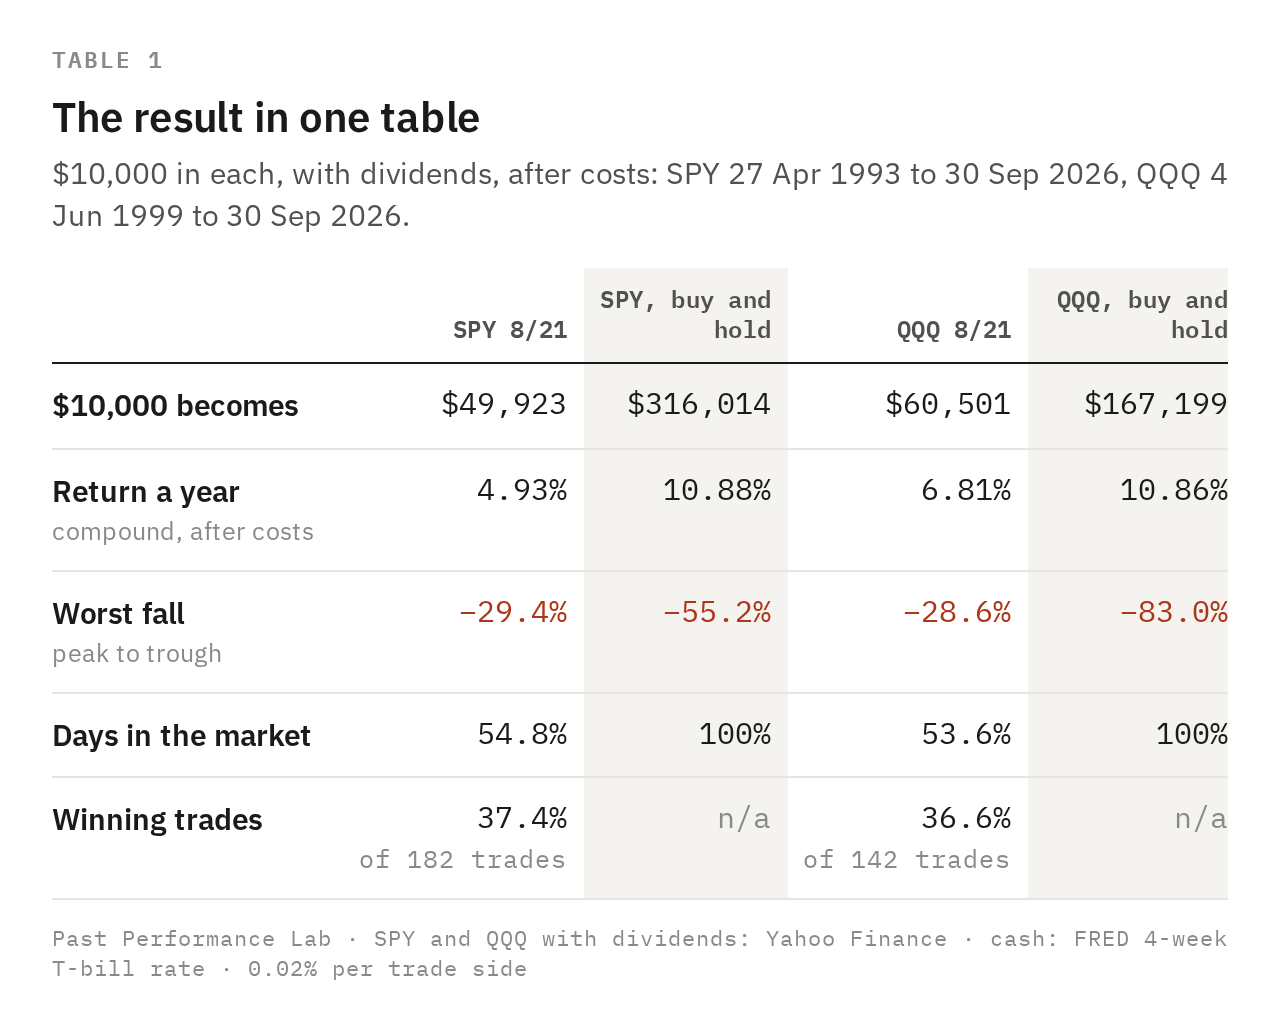
It is also simple enough to test exactly. So we did: every bullish 8/21 cross on SPY since 1993 and on QQQ since 1999, and the first pullback after each one when there is one (182 of 193 SPY crosses, 142 of 158 on QQQ), costs included, cash earning T-bill interest while out.
Verdict: trails the index.
8/21 EMA cross, buy the first touch of the 8-day EMA, sell on the opposite cross · SPY 1993–2026 and QQQ 1999–2026 · 2 bp a side · against buy-and-hold.
01 / WHAT REPLICATED
The setup makes money, and it does dodge the worst falls
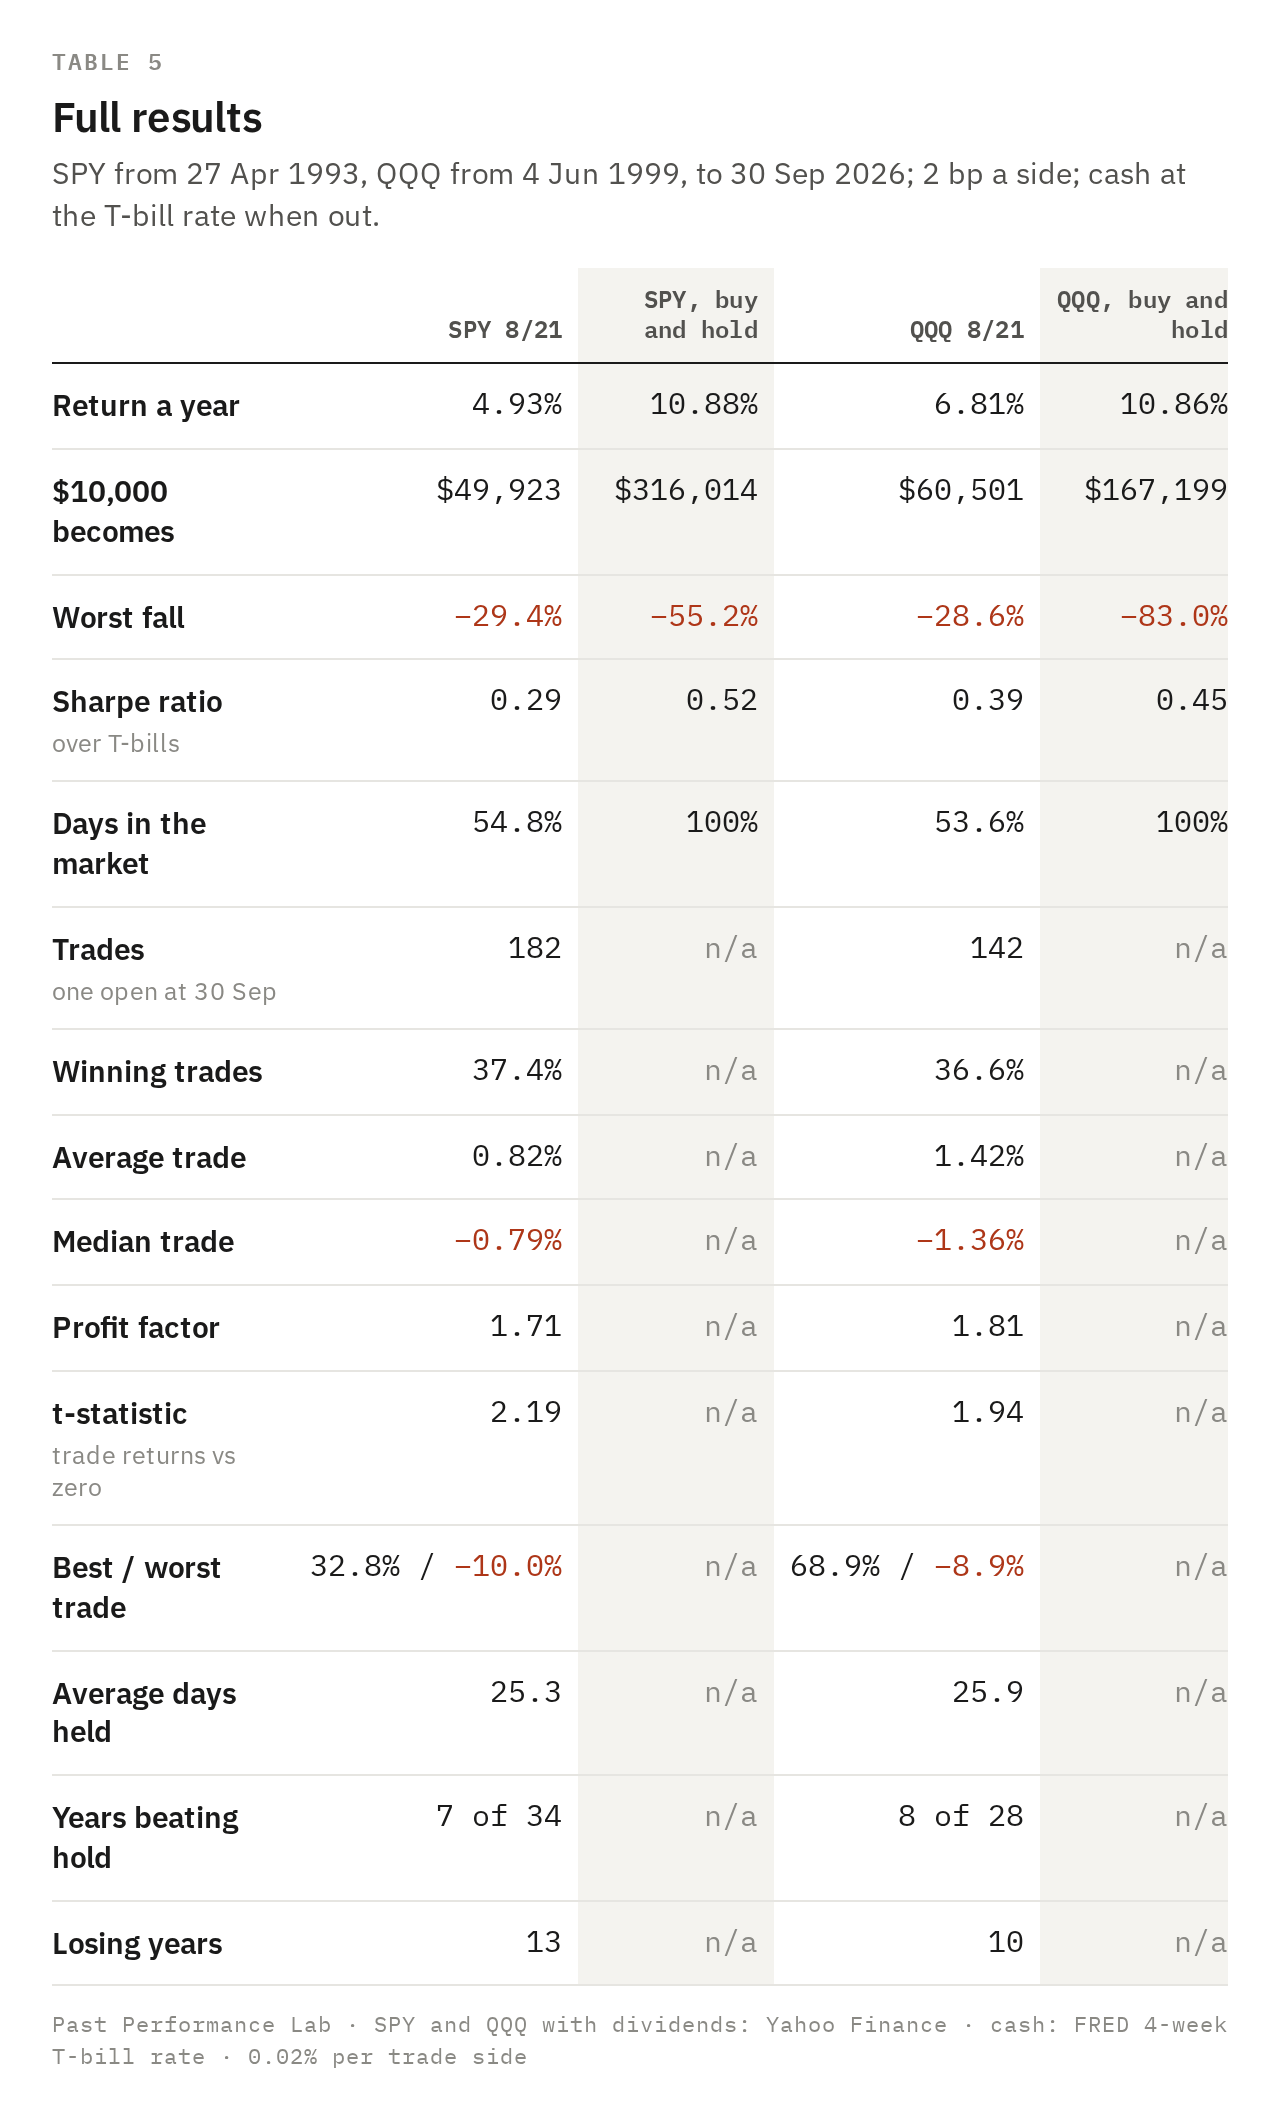
Start with what is true. Each trade earns a little on average (t-statistic about two, borderline on QQQ): a thin edge, not a proven one. Winners run and losers are cut, so a strategy that wins only a little over one trade in three still ends ahead.
The drawdown claim holds too. On SPY the worst fall is about half of holding's; on QQQ about a third. If the only question is "does it keep me out of crashes?", the answer is mostly yes.
02 / WHAT DID NOT
Out of the market half the time, it ends with a sixth of the money
The cost of dodging is sitting out. The strategy is invested a little over half the days. Ten thousand dollars in SPY in 1993 ends with about a sixth of holding's money; on QQQ a little over a third.
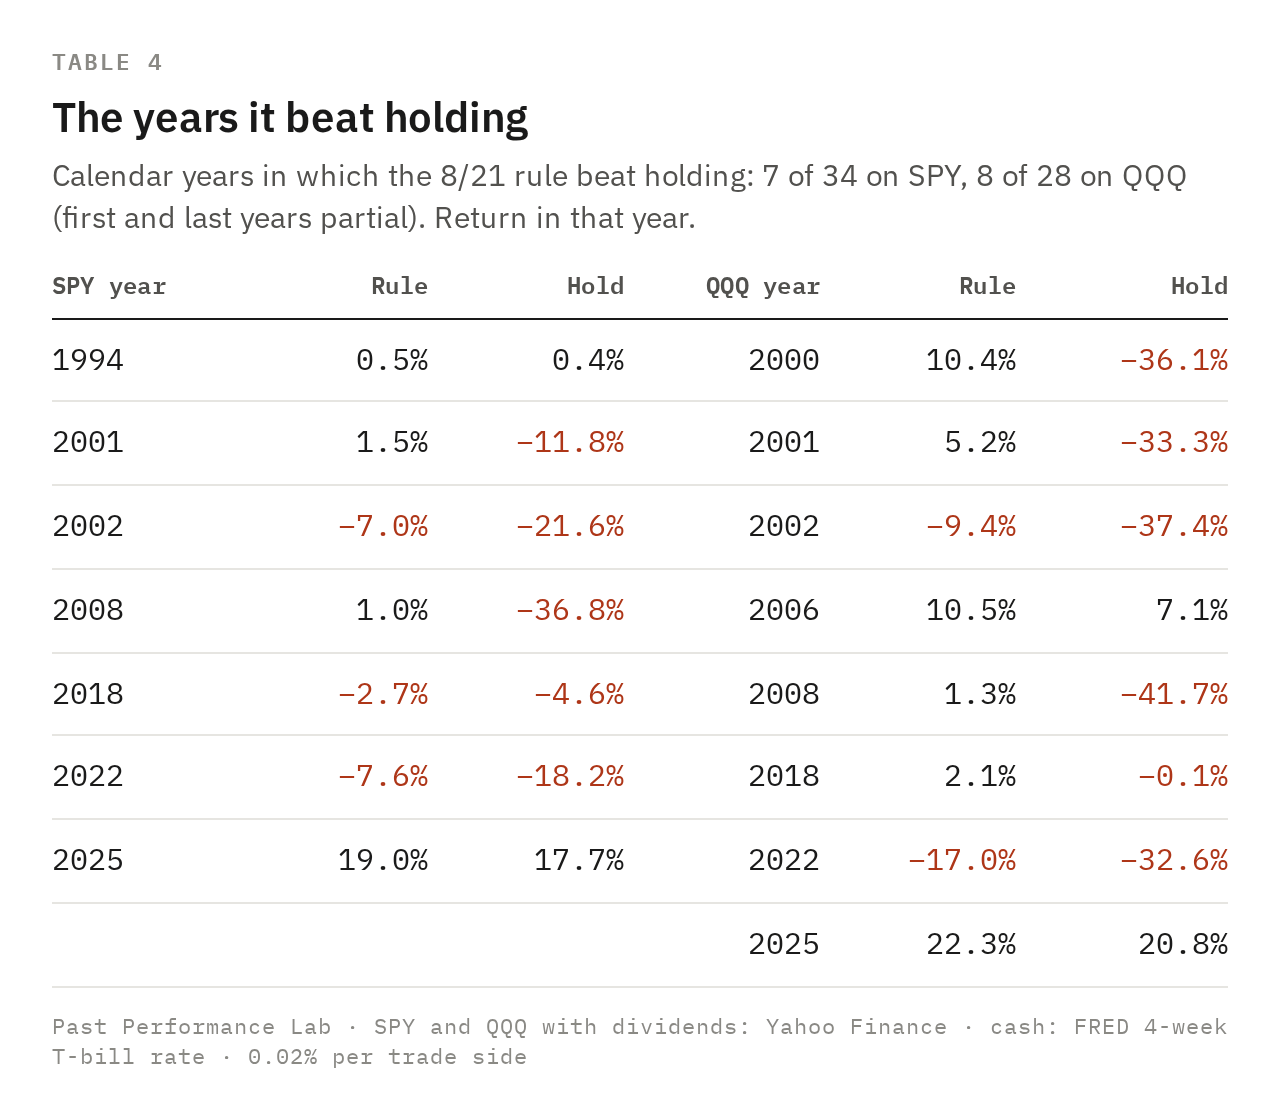
It beat holding in 7 of 34 calendar years on SPY and 8 of 28 on QQQ (first and last years partial). Five of SPY's seven and six of QQQ's eight came in years the index fell; in 2002 and 2022 the strategy lost money too, just less.
03 / THE ONE WINDOW IT WINS
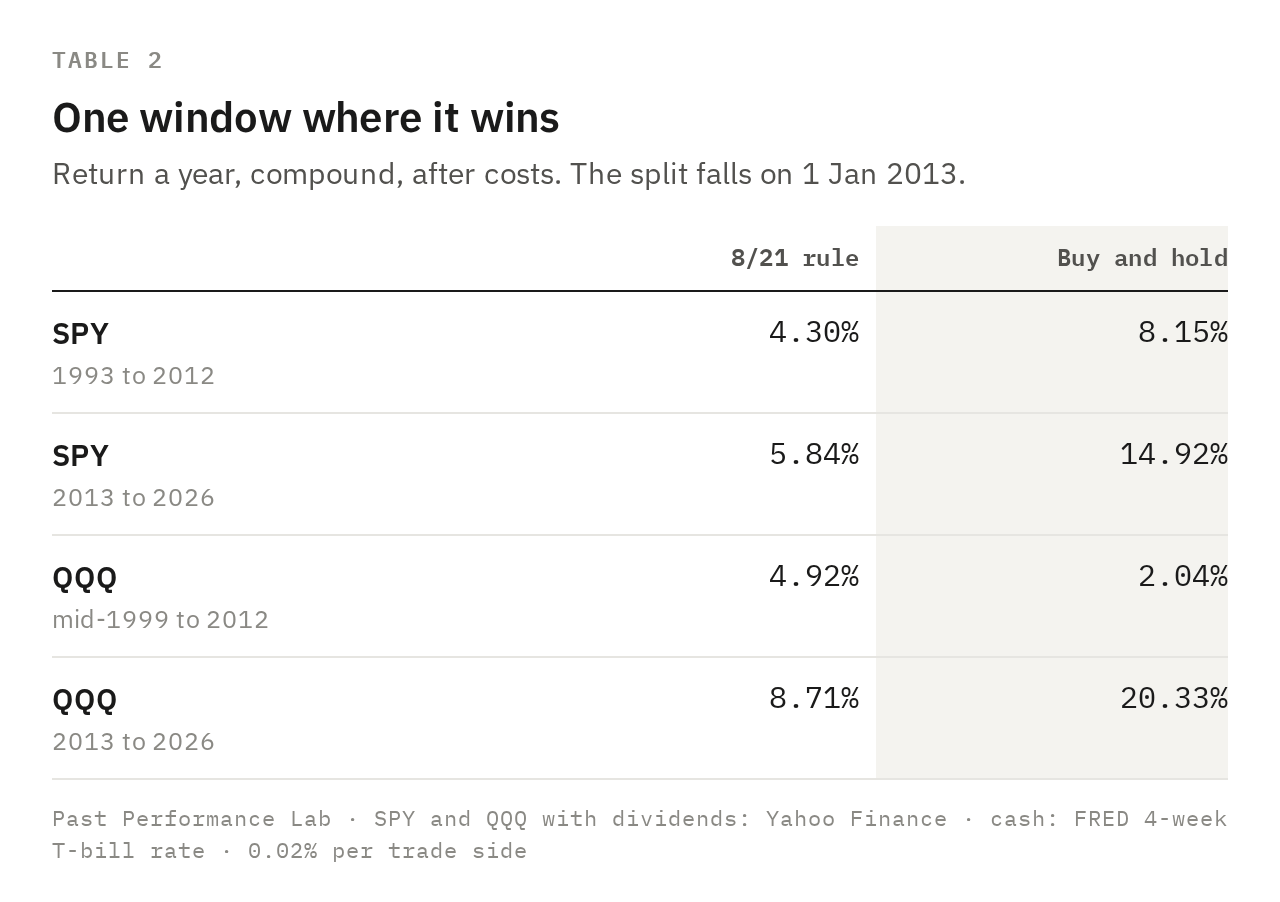
QQQ 1999–2012: when stepping aside was the whole game
There is one stretch where it won: QQQ from mid-1999 to 2012, through the dot-com crash and 2008. Holding earned about 2% a year in that stretch; the strategy more than doubled that. From 2013 on, holding QQQ ran away from it.
That is the honest shape of this rule. It is a crash filter with a large toll, and it pays off only in decades that crash hard and recover slowly, and even then only on QQQ, whose 2000–02 fall was deep enough; SPY trailed in the same years.
04 / IS 8/21 SPECIAL?
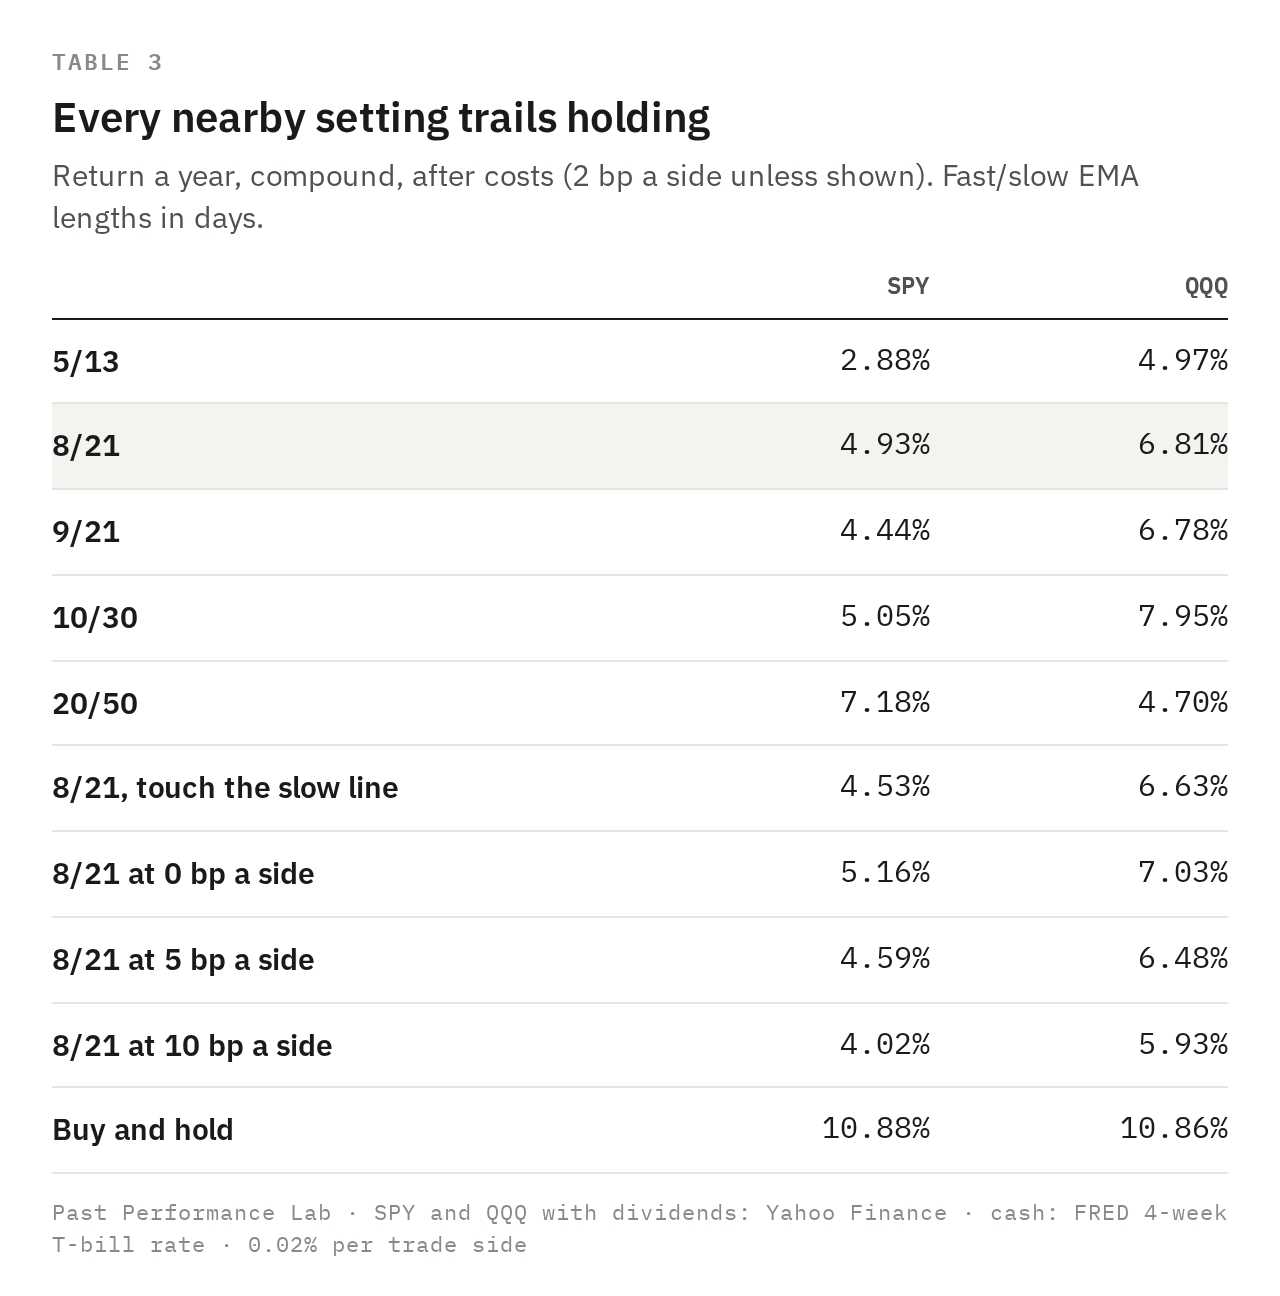
No. Every nearby setting trails holding
We moved the averages (5/13, 9/21, 10/30, 20/50), touched the slower average instead of the faster one, and tried costs from 0 to 10 bp a side. None of it beats holding. 8/21 is neither the best nor the worst: mid-table on SPY, second on QQQ. Not a lucky outlier, and not a magic pair either.
The transferable part
Count the days out. A rule that is invested half the time must earn nearly twice as much per day invested to keep up. Ask for exposure next to every win rate.
Ask "against what?" A drawdown halved is only good news if the money at the end is close. Compare final dollars, not just the worst month.
Find its one good window. Most timing rules have a stretch they win. Check whether the claim rests on it.
Your turn
Send us the strategy you are about to risk money on. Reply to this email or write to [email protected]. The first reader submission becomes Reader Test #1.
Method
Rules as published by Justin Banks on X: the 8 EMA crosses above the 21 EMA, buy the first pullback. The post does not define the pullback or the exit, so we chose a touch of the 8-day EMA and an exit on the opposite cross, and show the 21-day touch too. We test the long side only.
Data: SPY and QQQ daily prices, raw and total-return adjusted, frozen to one file before the test (md5
5efa8323eaa5d3fbfad614f949ec2693, last session 30 Sep 2026). NYSE calendar.Signals on raw closes; returns on total-return prices. EMA 8 and 21 (standard recursive EMA). Setup: EMA8 closes above EMA21 after being at or below it. Entry: the first later day in the setup whose low is at or below EMA8; buy at the next open; one entry per setup. Exit: the next open after EMA8 closes below EMA21. 60-session warm-up before the first signal.
Costs 2 bp a side (0, 5 and 10 bp shown). Cash earns the daily 4-week T-bill rate (FRED) when out. Annual returns by elapsed years.
Trade counts and win rates include one open trade per ETF, valued at 30 Sep.
Ties: no session had the two averages within 1e-6 of each other, so no result depends on a tie.
Windows: SPY 27 Apr 1993 – 30 Sep 2026; QQQ 4 Jun 1999 – 30 Sep 2026.
Full method: How We Test a Trading Strategy.
Past performance is no guarantee of future results. We check anyway.
This is research on historical data, not investment advice. Full disclaimer.