

Issue 14 · November 2026 · 1 viral claim · 6 crashes since 1950 · 3 thresholds on SPY, 1993–2026
A Spanish-language YouTube video says buying the S&P 500 after a 30% fall loses money only 3% of the time over the next 12 months, with an average gain of 22%. The 3% is real, but the way it is counted is the trap.
It counts every trading day the index spent 30% below its peak as a separate bet: 1,008 days since 1950. Those days come from just six crashes, and the first buy lost money in two of them.
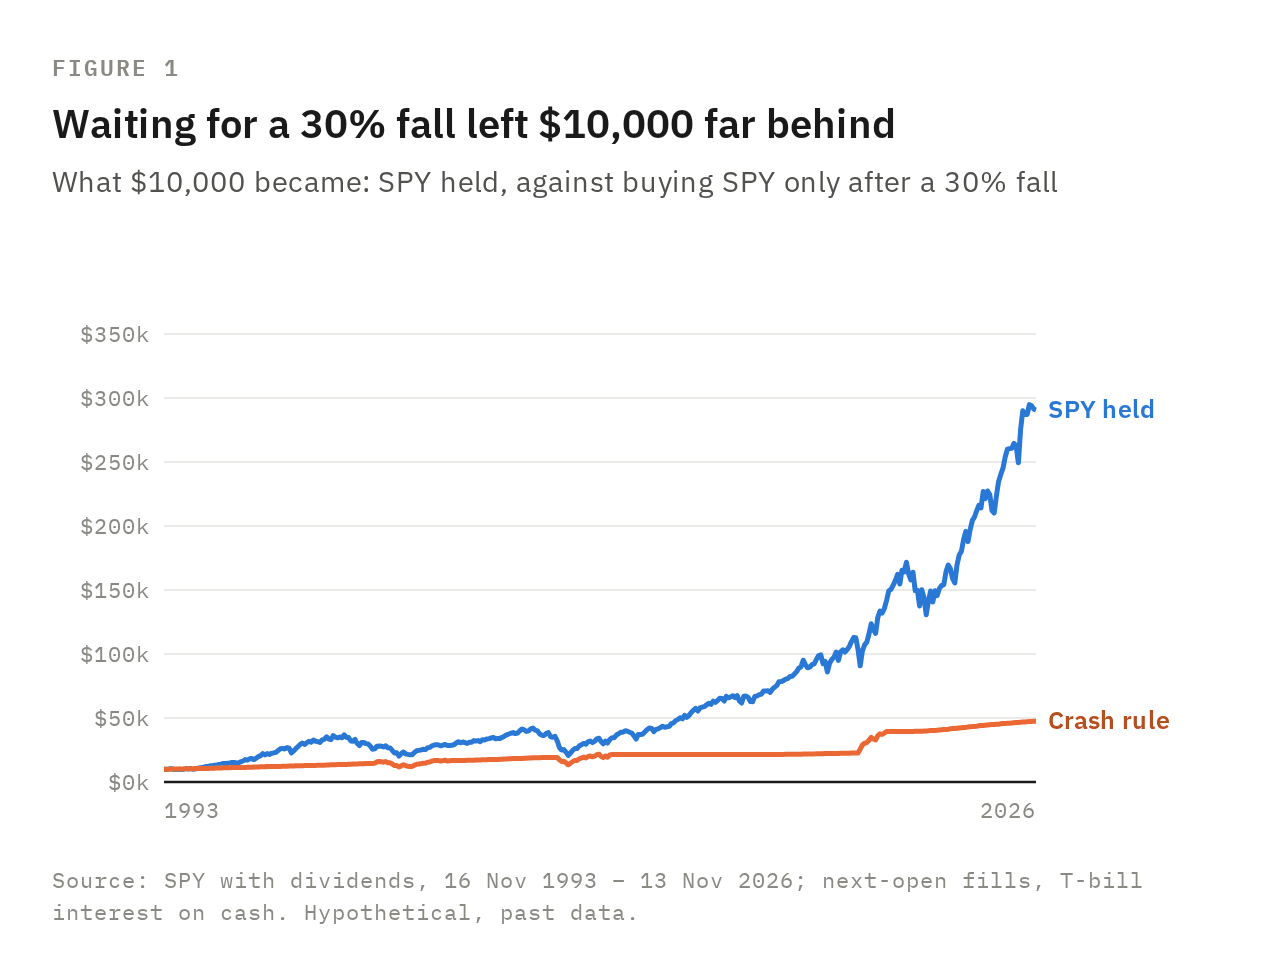
Run as a strategy, the wait cost more than the crashes paid. Since 1993, $10,000 that bought SPY only after a 30% fall grew to about $48,000; left in SPY, it grew to about $291,000.
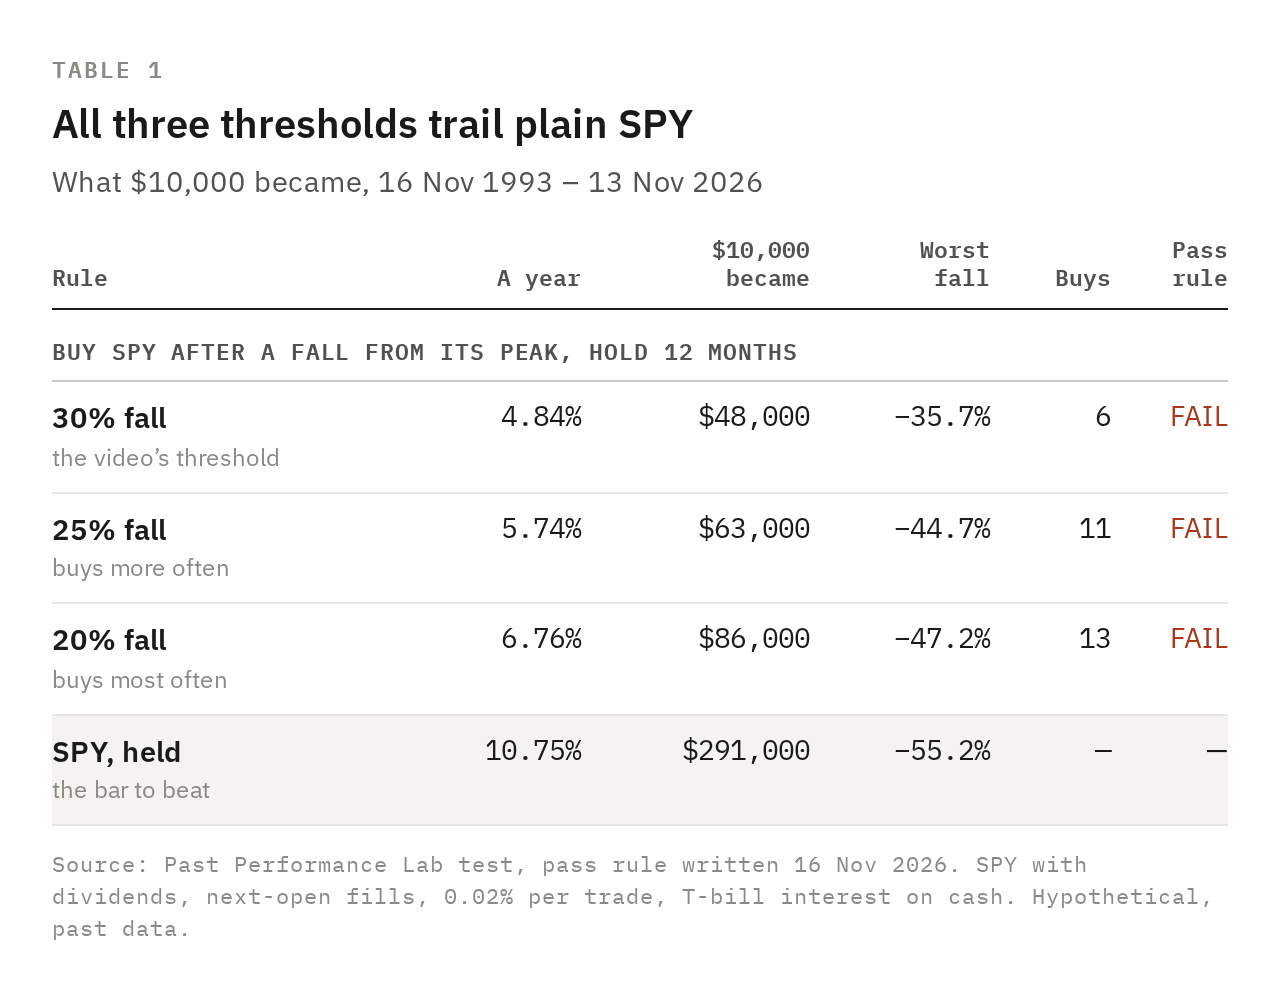
Verdict: FAIL, 0 of 3 thresholds pass. Buying SPY only after a 30%, 25% or 20% fall earned 4.84%, 5.74% and 6.76% a year; holding it earned 10.75%.
SPY with dividends, 16 Nov 1993 – 13 Nov 2026, buy at the next open, hold 252 trading days, T-bill interest while waiting, 0.02% per buy or sell.
Three checks before you trust a “chance of losing” number
Count the crashes, not the days. 1,008 days from six crashes are six results, not 1,008.
Ask what the money does while it waits. This rule sat in T-bills 81.8% of the time, and the wait cost more than the crashes paid back.
Compare it with holding the index from the same day. The rule won 5 of its 6 trades and still ended far behind.
01 / THE CLAIM
Six crashes, counted 1,008 times
The video’s numbers roughly reproduce on the S&P 500 price index since 1950. Of the 1,008 days at least 30% below the peak, 4.4% were followed by a 12-month loss, and the average gain was 20.0%.
Those days are not separate bets. Two crashes, 2001 and 2008, supplied 761 of them.
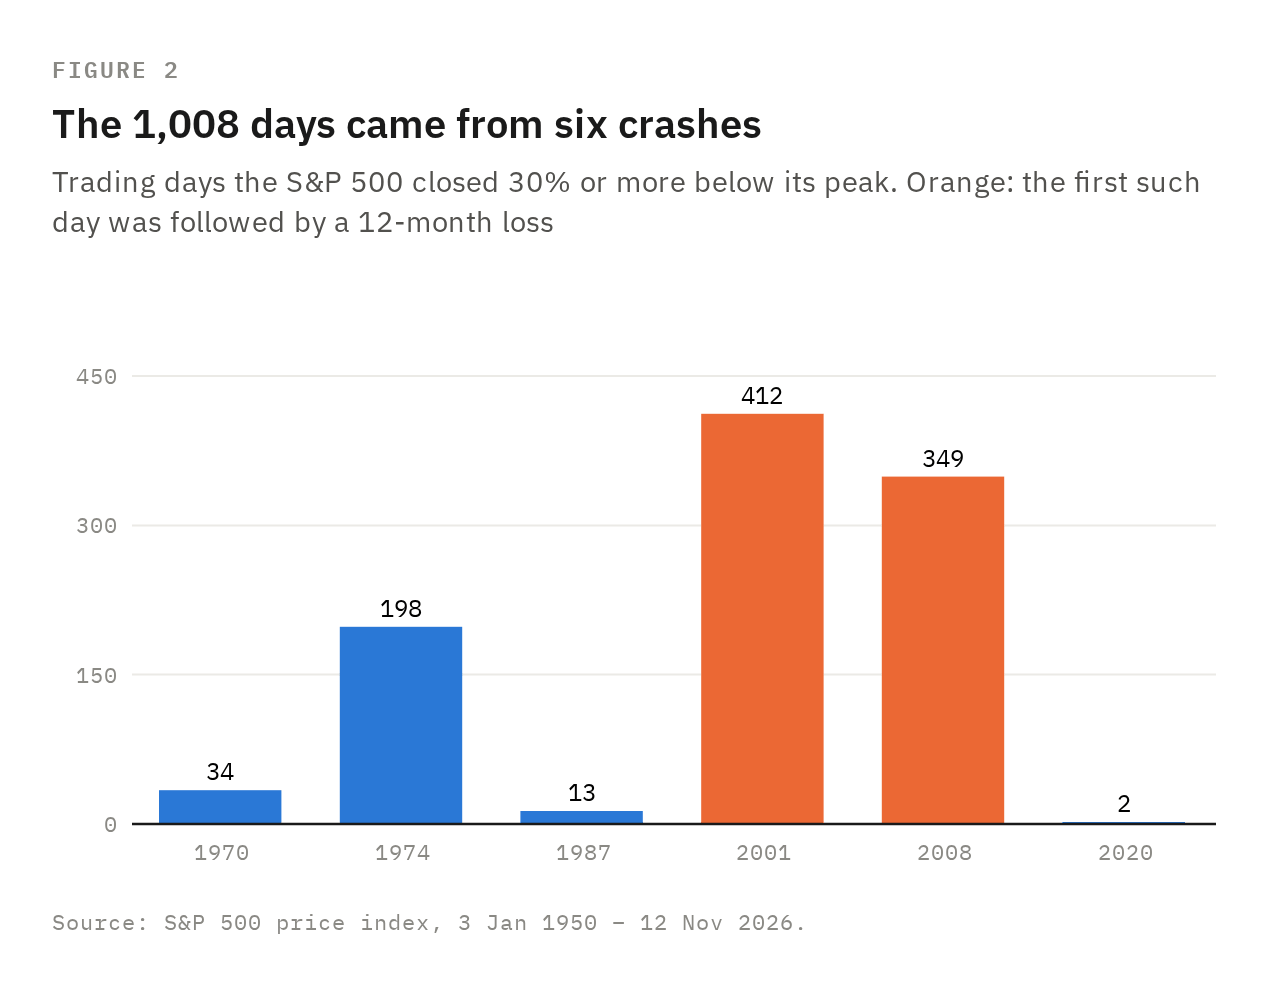
Count each crash once, from its first close 30% below the peak, and the index lost money over the next 12 months in 2 of 6: −15.9% after September 2001 and −0.2% after October 2008.
With dividends, on the whole US market, all six first buys made money. Six results cannot carry a number like 3%.
02 / THE STRATEGY
Waiting for the crash cost more than the crash paid
We turned the claim into a rule anyone can follow with SPY. Buy at the next open after a close 30% below the all-time high, hold 252 trading days (about 12 months), and buy again if the index is still that low.
From 16 Nov 1993 to 13 Nov 2026, the rule bought 6 times and won 5, including +74.5% after March 2020. It was invested 18.2% of the time; the rest sat in T-bills.
That idle cash is the cost. On $10,000, waiting for 30% falls ended about $243,000 behind holding SPY.
Lower thresholds buy more often and still trail: 5.74% a year at 25% and 6.76% at 20%, against 10.75% for SPY.
03 / ON TOP OF SPY
As an add-on, a little more return and a deeper fall
The other way to use the signal is a top-up: hold SPY in full and borrow to buy as much again after a crash. The fair opponent is steady leverage, which borrows the same average amount every day, as in Issue 13.
At 30%, the top-up earned 11.75% a year against 11.62% for steady leverage. Its worst fall was −75.3%, 12.9 points deeper than steady leverage’s −62.4%.
At 25% it earned less than steady leverage, 11.86% against 12.25%. At 20% it earned a little more, 12.65% against 12.48%, with a fall 9.8 points deeper.
So the add-on fails as well. Its extra return came with a deeper hole.
04 / SHOULD YOU USE IT
What survives, and what to do on Monday
What survives: on average, days 30% below the peak were followed by better years than the average day since 1950, 20.0% against 9.5%. Money you were going to invest anyway did well going in after a fall.
What fails is the wait. Over 33 years, the cash held back for the next crash cost far more than the crashes paid.
Monday’s version: if you hold an index fund, this test gives no reason to sell and wait for the next crash.
Your turn
Send us the strategy you are about to risk money on. Reply to this email or write to [email protected].
Method
Pass rule, written 16 Nov 2026, before the run. Each threshold had to beat SPY’s annual return on its own: full window, next-open fills, costs charged once. One test per threshold, each judged alone.
Signal. The fall is measured on SPY’s price without dividends, from its all-time closing high, as the claim measures it. Buy when the close is 30% (25%, 20%) or more below; hold 252 sessions; buy again if it is still below.
Returns. SPY with dividends reinvested, fills at the next open, 0.02% per buy or sell, daily T-bill interest on cash. Window 16 Nov 1993 – 13 Nov 2026, after a 200-session warmup.
Top-up, reported only. It doubles SPY with borrowed money for the 252 sessions after each signal, at the T-bill rate plus 1.5 points. Steady leverage holds 1 + E times SPY every day, where E is the share of sessions with the top-up on, at the same rate.
The 3% check. S&P 500 price index (^GSPC), 3 Jan 1950 – 12 Nov 2026, 12 calendar months forward. With dividends: the Fama-French US market series to 30 Jun 2026.
The video’s author is welcome to reply; we will publish any answer in full.
Full method: How We Test a Trading Strategy.
Past performance is no guarantee of future results. We check anyway.
This is research on historical data, not investment advice. Full disclaimer.