

Issue 10 · October 2026 · 91 trades · 33 years · 18 settings · 1 family test
Nine wins out of ten. That is the promise of Triple RSI, a dip-buying rule for the S&P 500 published by Quantified Strategies. We expected the number to shrink once we ran it ourselves.
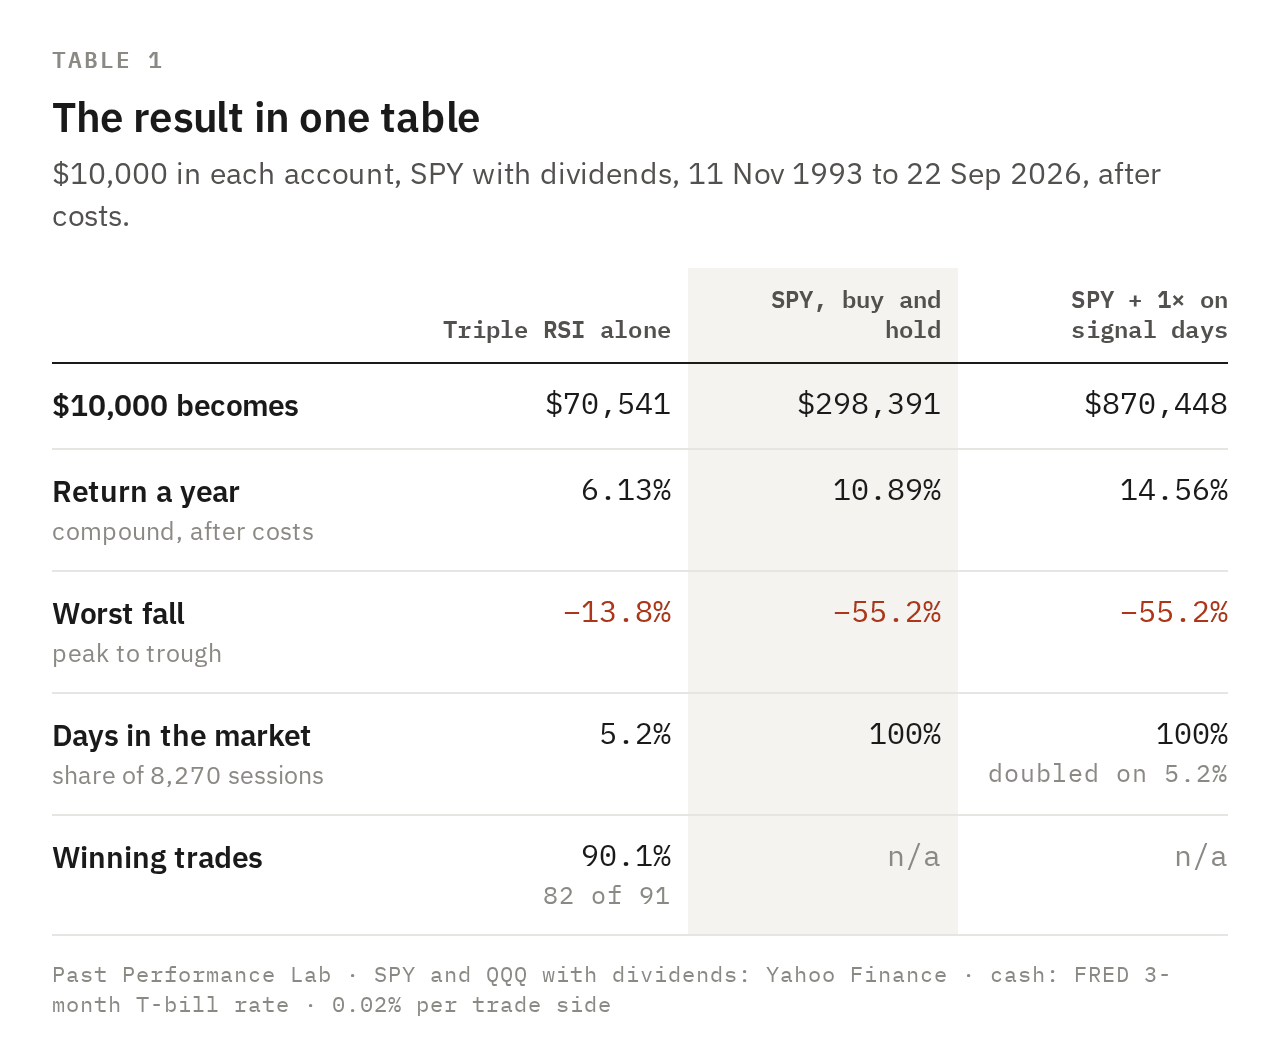
It did not shrink. The win rate came out at 90.1% across 91 trades since 1993. And an account that traded it still ended with less than a quarter of what a plain index holder made.
Verdict: the claim is true, the strategy trails the index badly on its own, and it earns its keep only as a top-up on an index position.
SPY total return, 11 Nov 1993 – 22 Sep 2026, NYSE sessions, a 0.02% cost per trade side, cash in T-bills when flat.
The 60-second verdict
What it claims. Buy the S&P 500 fund after a three-day slide in a short-term momentum gauge, while the long-term trend is up. Sell on the bounce. Win about 90% of the time.
What we found. The 90% is real: 82 winners in 91 trades. But the rule trades about three times a year and sits in cash 95% of the time.
The $10,000 test (Nov 1993 – Sep 2026). The strategy turned $10,000 into about $70,500. Just holding the index fund turned it into about $298,000. Holding the fund and doubling up on signal days made about $870,000, using borrowed money.
Should you use it? Not on its own. Only as an add-on to an index position you already hold, and only if you can carry double exposure on bad days.
01 / THE CLAIM
The 90% reproduces
RSI is a 0-to-100 gauge of how hard a price has fallen or risen lately. Triple RSI buys SPY at the close when the five-day RSI is below 30 and has fallen three days running. It also needs RSI below 60 three days earlier and a price above its 200-day average. It sells when RSI climbs back above 50.
We ran it on SPY with dividends, on real exchange sessions, with a small cost on every trade. The source reports 83 trades and a 1.4% average gain. With data to September 2026 we count 91 trades and 1.35%, and 90.1% of them won. The average trade lasted under five trading days.
Then we tried to break it. The published setting and 17 nearby variations all won between 82% and 92% of their trades. Doubling the costs moved the yearly return from 6.1% to 6.0%. If you saw this win rate in a screenshot, you saw the truth.
02 / THE CATCH
A win rate is not a return
Here is what the screenshot leaves out. The rule fires about three times a year and holds for about five trading days. So your money is in the market one day in twenty.
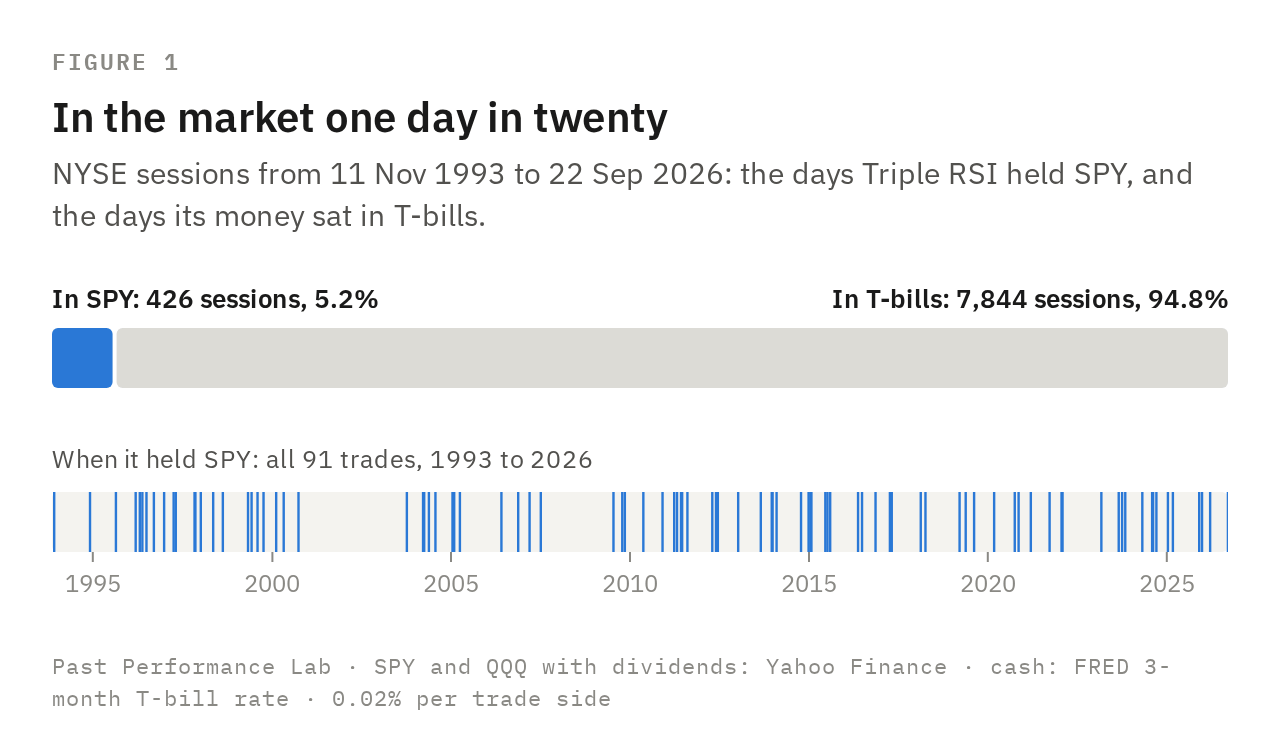
The other nineteen days it earns the T-bill rate. Add it up and the account grows 6.1% a year. SPY, held and ignored, grew 10.9%.
That gap compounds. Over almost 33 years it is the difference between $70,500 and $298,000. You win nearly every trade and still finish far behind someone who never traded.
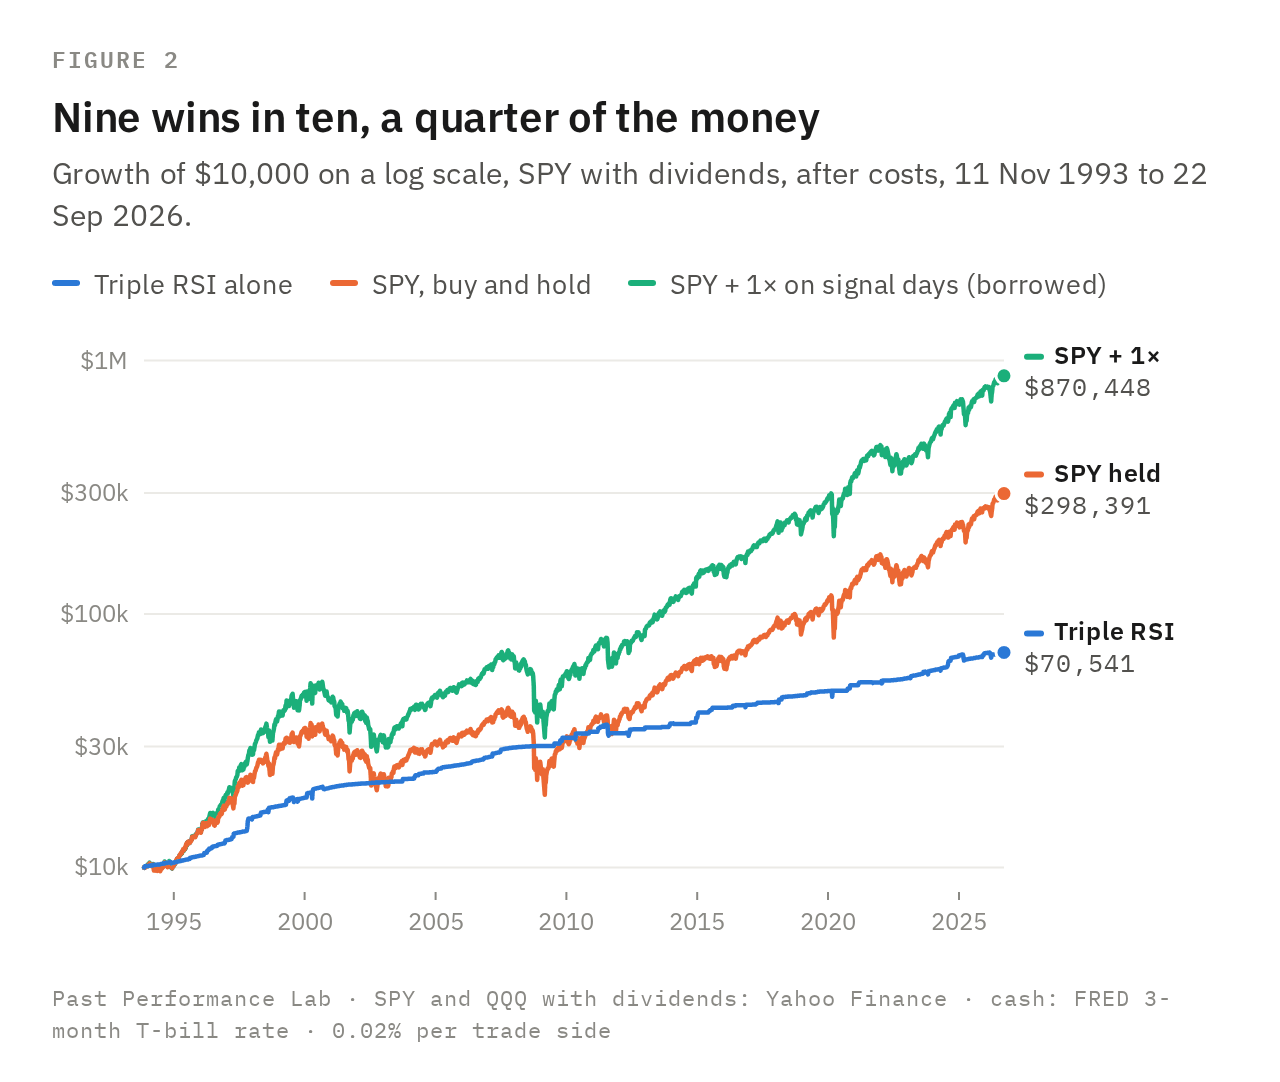
There is one real consolation. The strategy's worst fall was 14%, against 55% for the index. If you could not sit through a halving, that matters. You pay for the comfort with three quarters of the final wealth.
03 / THE USE
It works as a top-up, not as a strategy
So is the signal useless? No. Ask a different question. What if you hold SPY anyway and add a second position only on signal days?
That version grew 14.6% a year against 10.9%. It beat plain SPY in 27 of 34 calendar years. This is the shape we keep finding: a rule that is weak alone can be a useful sidekick to the index.
Three warnings before you copy it. The top-up is borrowed money, so you need margin or futures. It does nothing in a crash: the worst fall is the same 55%.
And the edge has thinned. Since 2020 the win rate is 81%. The top-up still added about two and a half points a year over that stretch, but it trailed plain SPY in 2025 and so far in 2026.
04 / THE BAR
Against the Nasdaq, it is closer than it looks
Our bar is the Nasdaq 100 fund, QQQ. SPY is only the floor. Run the same rules on QQQ and the win rate drops to 82% across 76 trades. The top-up still helps there: 12.0% a year against 9.2% for plain QQQ since December 1999.
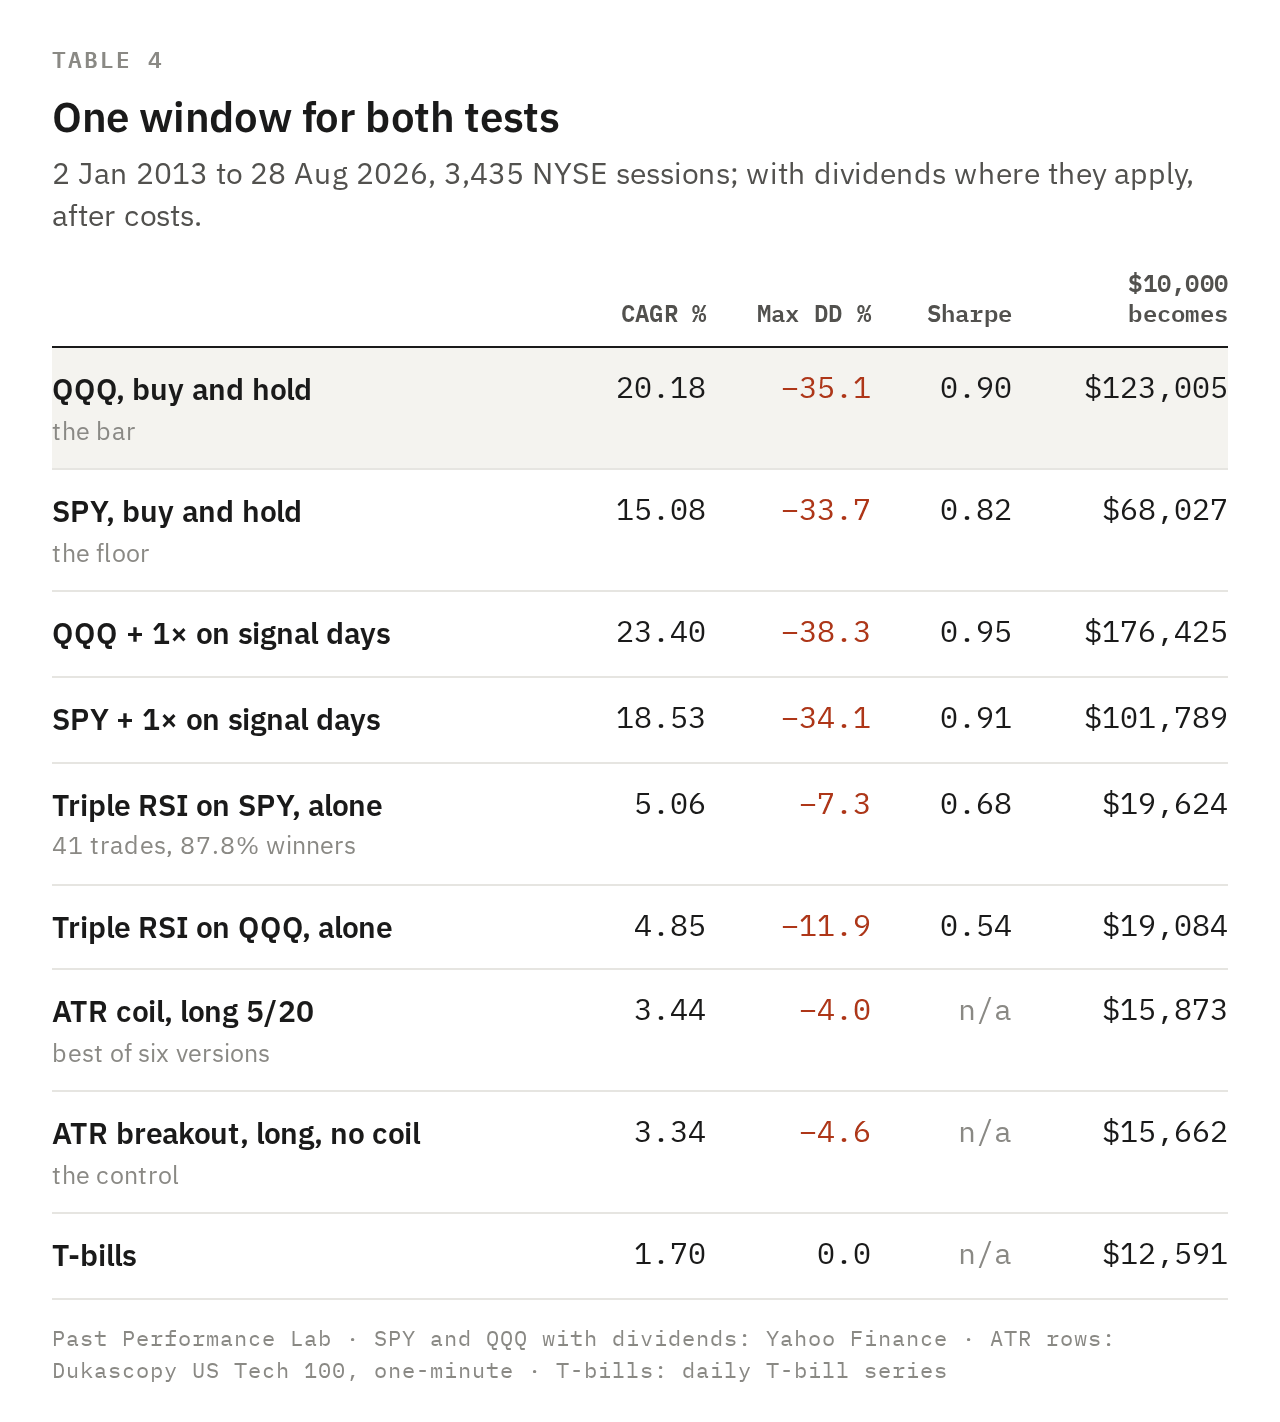
Now look at the years when the Nasdaq ran. From 2013 to August 2026, SPY plus the top-up grew 18.5% a year. Plain QQQ grew 20.2%. If you held the Nasdaq through those years, this signal on SPY would not have beaten you. Since December 1999 as a whole, it would have: 11.4% a year against 9.0%.
Same family: the ATR coil breakout
A cousin of dip-buying is the volatility breakout. One version, from Breakout Trading Academy, buys the Nasdaq 100 when price jumps 2.5 "average ranges" above a bar's open. It trades only after a quiet spell, the "coil". We read the rules from partial captures, so this is our reading; if the academy shares the exact rules, we will rerun it.
We tested six versions on one-minute index data from 2013 to August 2026. Every one beat cash, and none by much. The best grew 3.4% a year, against 1.7% for T-bills and 20.2% for QQQ.
The coil added almost nothing to the account. The same breakout with no quiet-spell filter grew 3.3% a year. When you can delete a rule's key idea and keep the result, you are not buying that idea.
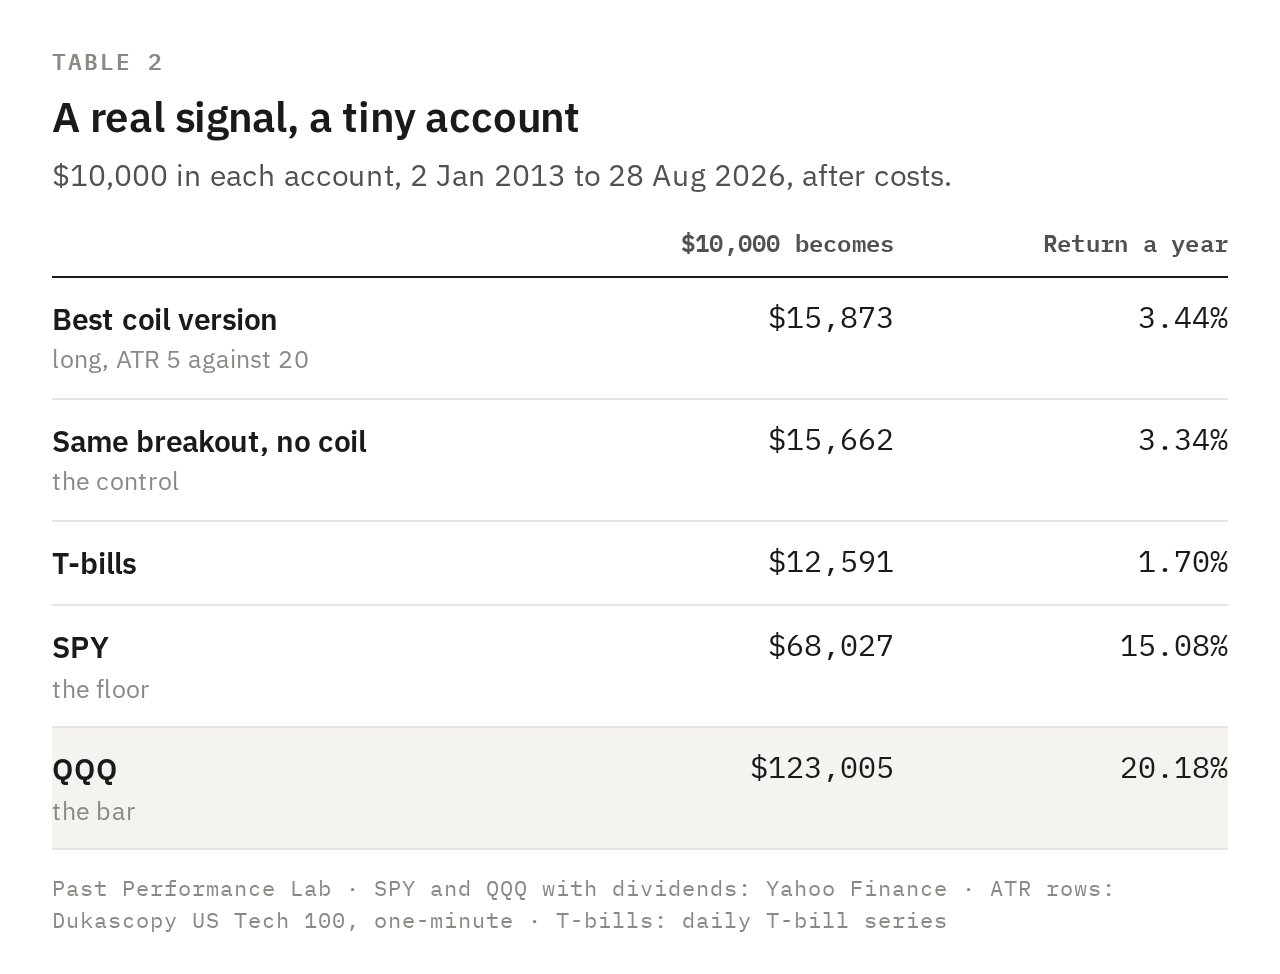
Verdict: doesn't beat the bar.
THE TRANSFERABLE PART
Three checks for any win-rate claim
Ask for the days in the market. A 90% win rate on one day in twenty leaves nineteen days earning cash. You need both numbers.
Ask what $10,000 became. Put it next to the index over the same dates. A screenshot of winning trades cannot answer that.
Delete the clever part. Rerun the rule without its special filter. If the result stays, the filter was decoration.
Your turn
Send us the strategy you are about to risk money on. Reply to this email or leave a comment with a link and the rules as you understand them. We test the ones readers ask for most.
For the quants
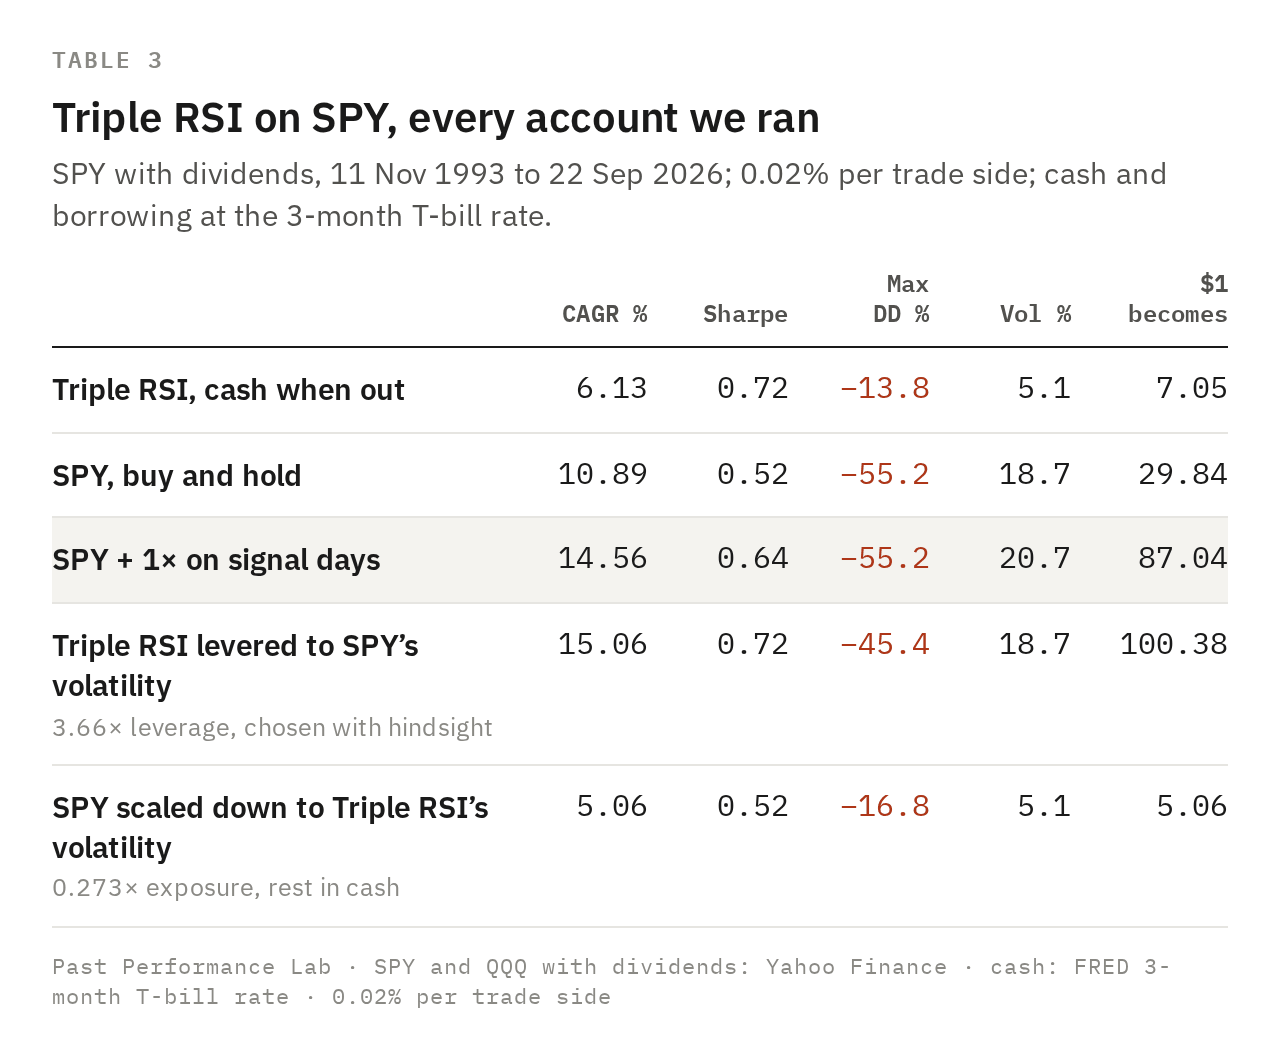
Trades (to 21 Sep 2026): 91; 90.1% wins; +134.5 bp average; profit factor 7.09; t 7.14; average hold 4.7 trading days; worst −7.4%, best +7.8%. Exposure 5.15%. Cash alone: 2.45% a year.
Overlay (the +1× stream, excess over cash): +366 bp a year, t 4.09. By calendar year (1993 and 2026 partial): ahead of SPY in 27 of 34, behind in 4 (1994, 2011, 2025, 2026 to date), level in 3 (2001, 2002, 2008: no signals).
Halves: 11 Nov 1993 – 13 Apr 2010: 7.44% vs SPY 7.85% (38 trades, 92.1% wins, t 6.47). 14 Apr 2010 – 21 Sep 2026: 4.83% vs 14.01% (53 trades, 88.7% wins, t 4.16). Since 2020: 5.37% vs 15.56% (21 trades, 81.0% wins, t 2.26); SPY + 1× 18.06%.
Costs: 6.24% at 0 bp, 6.13% at 2 bp, 6.01% at 4 bp per side. Signals on the unadjusted close: 90 trades, 90.0% wins, 5.96%.
Neighbourhood, 18 cells including the published one (entry 25/30/35 × exit 40/50/60 × prior 50/60): wins 82–92%, t ≥ 3.08, CAGR 4.10–6.41%. No cell is near SPY's 10.89%.
QQQ, 21 Dec 1999 – 22 Sep 2026: 76 trades, 81.6% wins, t 4.18. Alone 5.01% vs QQQ 9.17%; QQQ + 1× 11.96% (max DD −82.8% vs −83.0%); overlay +322 bp a year, t 2.43; ahead in 21 of 28 years.
SPY rules against the QQQ bar, 22 Dec 1999 – 22 Sep 2026: SPY 8.38%, SPY + 1× 11.43%, QQQ 8.96%.
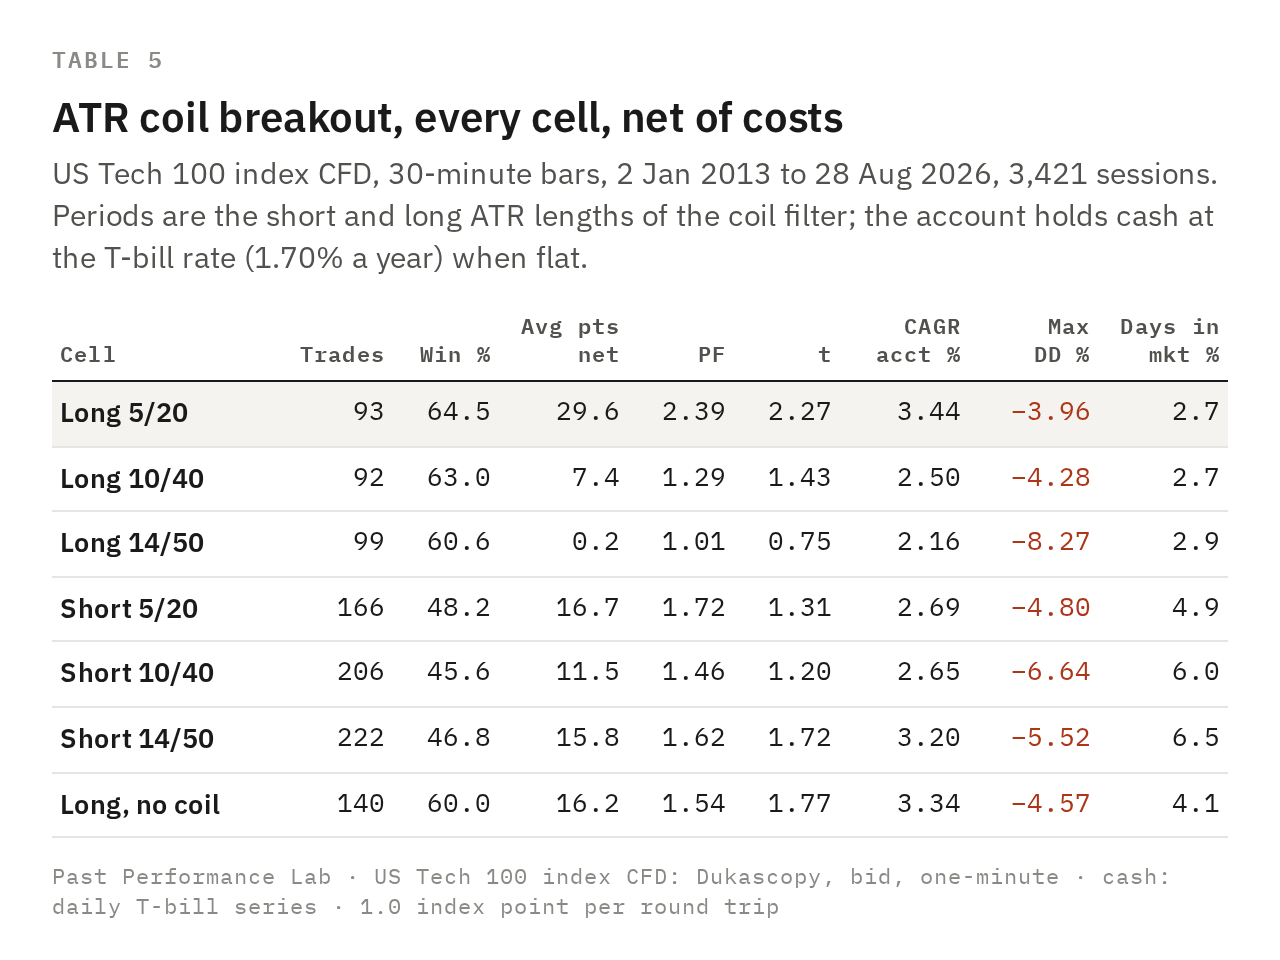
Six cells were tried; the best t is 2.27. With six tries that is not evidence (a later issue on multiple testing covers why).
On the long side the result falls as the ATR periods lengthen (29.6 → 7.4 → 0.2 points a trade). The source did not publish the periods.
Per trade the coil filter nearly doubles the long average (29.6 against 16.2 points, on 93 trades against 140). In the account it adds about 0.1 point a year (3.44% against 3.34%).
Method
Triple RSI. Rules from the Quantified Strategies page, matched condition by condition on 17 Oct 2026. Buy at the close when RSI(5) < 30, RSI(5) has fallen three days in a row, RSI(5) three days ago was < 60 and the close is above the 200-day average. Sell at the close when RSI(5) crosses above 50. Wilder RSI. SPY and QQQ total return (Yahoo Finance), NYSE sessions. Cash and financing at the 3-month T-bill rate (FRED DTB3). 0.02% (2 bp) per side. CAGR over elapsed years; Sharpe on daily excess returns × √252.
Ties and price series. "Fallen" means strictly lower. When SPY closes unchanged, its RSI(5) does not move, and we never count that as a fall. Example: SPY closed flat on 22 Jul 1998, so 24 Jul 1998 was not a third straight fall, and the next entry came on 4 Aug. Reading unchanged days as falls instead gives 95 trades, 88.4% winners and 5.80% a year. Signals on unadjusted closes, as a price chart shows them, give 90 trades, 90.0% winners and 5.96% a year. The prices behind every number here are frozen in one file, downloaded on 18 Oct 2026.
Add-on. Hold the index 100% always; on signal days add +1× of the same fund, financed at the T-bill rate. A broker charges more: about 0.5–1.5 points on the borrowed slice, which at 5% exposure costs at most about 8 bp a year. The vol-matched leverage uses the full-sample volatility, so it is an illustration, not a tradeable rule.
ATR coil. Dukascopy US Tech 100 index (a CFD on the index, bid prices), 1-minute, NYSE sessions only, placeholder minutes removed (Issue 09 explains them). 14 NYSE sessions (12 in 2013, 2 in 2014) hold only placeholder minutes in the tape and are skipped; 20 more end early, which touches no trade of the best version. 30-minute bars from the open. Entry: a stop 2.5 × ATR(20) above the bar's open (below, for shorts), filled at the first minute that trades through. Filter: short ATR below long ATR at the prior bar. Exit at the session's last minute. One trade a day. Cost: 1.0 index point per round trip. Account at 1× notional; cash earns the daily T-bill series on every session in the run. Rules as we read them from partial captures.
Cash series. Triple RSI uses FRED DTB3; the ATR rows and Table 4's T-bill row use our daily T-bill series. Over 2013–2026 they earn 1.76% and 1.70% a year; no verdict moves.
Full method: How We Test a Trading Strategy.
Past performance is no guarantee of future results. We check anyway.
This is research on historical data, not investment advice. Full disclaimer.
On the coil breakout: is the stop filled at the stop level, or at the price of the minute that trades through it? Breakouts are where slippage lives, and on a CFD the price comes from the broker’s own feed. A few points of slippage could matter more than the 1-point cost.